
Curriculum
Every masterclass starts with Unit 1 and runs in order. The Foundation masterclass ends after Unit 8, the Advanced masterclass after Unit 12, and Advanced + Paleoceanography takes all 16.
How the Ocean Works
The Oceanographer's Toolkit
The numbers, tools, and physics that the whole masterclass builds on
About this unitThis unit opens with the ocean itself: how large and how deep it is, how little of it has been visited, and why it matters for everything on the planet. It then builds the toolkit the later units use: powers of ten, rates and fluxes, latitude and longitude, the instruments that measure the sea from ships, floats, and satellites, and the physics of density, pressure, buoyancy, and heat.
- The ocean in numbers
- Scientific notation and rates
- Position and depth at sea
- Pressure, buoyancy, and heat
- Profiles, sections, and maps
- Ships, floats, and satellites
Ocean Basins and the Seafloor
The shape of the ocean basins and the plate tectonics that made them
About this unitFrom the shelf break to the trenches, this unit draws the shape of the ocean basins and explains it with plate tectonics: seafloor spreading, the magnetic stripes, subduction, and hot spots. It ends with the sediments that cover the floor and the ships and satellites that map it.
- Profile of a basin
- Seafloor spreading
- Trenches and subduction
- Sediments
- Mapping the seafloor
Salt, Heat, and the Density of Seawater
What is dissolved in seawater and how salt and heat set its density
About this unitSeawater is a solution whose ions keep the same proportions everywhere, which is why one number, the salinity, describes it. This unit explains how salinity and temperature are measured and defined, why a deep sample warms on the way up, and how the two together set the density that drives the circulation.
- Major ions and salinity
- Measuring salinity and temperature
- Potential temperature
- Density and the equation of state
- The mixed layer and the thermocline
- Temperature-salinity diagrams
The Ocean and the Atmosphere
How the sea and the air exchange heat, water, and momentum
About this unitThe sea surface is where the ocean gains the heat of the Sun and loses it again, mostly by evaporation. This unit works through the surface energy budget by latitude, the poleward transport of heat by ocean and atmosphere, the winds that drive the surface currents, the evaporation and rain that set the salinity of the surface, and the heat the ocean has taken up as the climate warms, ending with the tropical cyclone as the extreme case of the sea feeding the air.
- Surface energy budget
- Poleward heat transport
- Land and sea contrasts
- Winds and circulation cells
- Evaporation and surface salinity
- Ocean heat content
Wind-Driven Currents and the Great Gyres
How the wind and the rotation of the Earth drive the great current loops of every ocean
Free sample unitRead the full unit online or as PDFA steady wind does not push the surface water straight ahead. The rotation of the Earth turns it, and the result is the Ekman transport and the gyres that fill every ocean basin. This unit explains the Coriolis effect, the Ekman spiral, the hill of water in the middle of a gyre that satellites measure to the centimetre, and why the Gulf Stream is narrow and fast while the Canary Current is broad and slow.
- Wind stress
- The Coriolis effect
- Ekman transport
- The subtropical gyres
- Western intensification
- Drifters and floating debris
Waves move energy across the ocean while the water itself barely travels. This unit derives how the speed of a water wave depends on its wavelength and the depth, explains why a tsunami crosses the deep ocean at the speed of an airliner, works out how rare a rogue wave should be, and shows why the tide comes in twice a day and rises a metre at Bergen but sixteen in the Bay of Fundy.
- Wind waves and swell
- Dispersion and group speed
- Rogue waves
- Tsunamis
- The tide-generating force
- Tidal constituents and resonance
Seawater Chemistry and the Ocean Carbon Cycle
The gases, nutrients, and carbonate chemistry of seawater and the ocean's part in the carbon cycle
About this unitThe ocean holds about forty times more carbon than the atmosphere, almost all of it as bicarbonate. This unit explains the dissolved gases and nutrients and what their profiles reveal about the age of deep water, the carbonate system that buffers the pH of the sea, the solubility and biological pumps, where shells dissolve, and how the ocean's uptake of a quarter of human carbon dioxide emissions is measured and what it does to the chemistry of the surface sea.
- Dissolved gases
- Nutrients and the Redfield ratio
- The carbonate system
- The biological pump
- Saturation horizons
- Ocean acidification
The Global Overturning Circulation
Where the deep water forms, how it spreads, and what brings it back to the surface
About this unitIn a few small regions near the poles, surface water becomes dense enough to sink to the bottom and begin a journey of about a thousand years. This unit follows the water masses on a temperature-salinity diagram and in a section down the Atlantic, dates them with oxygen, chlorofluorocarbons, and radiocarbon, explains what brings the deep water back up, and shows how the Atlantic overturning and its heat transport are measured across a whole basin.
- Deep water formation
- Water masses and tracers
- The age of deep water
- Mixing and upwelling
- Measuring the overturning
- Heat and carbon transport
The Dynamic Ocean
Rotation, Geostrophy, and Ocean Eddies
The dynamics of a rotating ocean: geostrophic currents, the thermal wind, and the eddies that fill the sea
About this unitOn a rotating planet a current flows along the lines of equal pressure, not down the slope. This unit derives the Coriolis acceleration and the geostrophic balance, shows how a satellite that measures the height of the sea turns it into maps of the currents, and explains the thermal wind, the Rossby radius, and potential vorticity. With these tools it explains why the ocean's weather comes in eddies of a hundred kilometres that drift west for years, and what an ocean model computes.
- Coriolis acceleration
- Equations of motion
- Geostrophic balance
- Thermal wind
- Rossby radius
- Potential vorticity and Rossby waves
- Mesoscale eddies
- Ocean models
Coasts, Estuaries, and Upwelling
Where the ocean meets the land: estuaries, the coastal ocean, upwelling, storm surges, and the rising sea
About this unitThe coastal ocean is shallow, stirred by tides and local winds, and fed by rivers, and most of what the sea does to people happens there. This unit explains why fresh water flows out over the sea and salt water flows in underneath, how a wind along a coast draws cold water up from 200 m and feeds the richest fisheries on Earth, why a storm raises the sea by metres on a wide shallow shelf, and how tide gauges and satellites measure the 20 cm the sea has risen since 1900.
- Estuaries
- The coastal ocean
- Coastal upwelling
- Beaches and deltas
- Storm surges
- Sea-level rise
El Niño and Ocean Climate Variability
How El Niño starts in the tropical Pacific, how it is predicted, and what it does to the world
About this unitEvery few years the trade winds weaken, the warm water of the western Pacific spreads east, and the weather changes on every continent. This unit explains the normal tropical Pacific and the tilt of its thermocline, the Bjerknes feedback that lets a small push grow, the Kelvin and Rossby waves that end an event and set the rhythm of two to seven years, the indices and moorings by which El Niño is watched, the great events and their teleconnections, and how far ahead an El Niño can be predicted.
- The tropical Pacific
- The Bjerknes feedback
- Kelvin and Rossby waves
- Observing and predicting El Niño
- Worldwide effects
- Other oscillations
Polar Oceans, Sea Ice, and Ice Shelves
The Arctic and the Southern Ocean, the sea ice that covers them, and the ice shelves melting from below
About this unitThe two polar oceans could hardly be more different: a deep basin ringed by land with a fresh, cold lid, and a ring of water around a continent through which the largest current on Earth runs. This unit compares them, explains how sea ice forms, grows by Stefan's law, and reflects sunlight, follows the satellite record of its decline since 1978, and shows how warm water at a degree above zero melts the ice shelves of Antarctica from below and how satellites weigh an ice sheet.
- The two polar oceans
- Sea ice formation and growth
- The ice-albedo feedback
- The satellite record
- The Antarctic Circumpolar Current
- Ice shelves and sea level
The Ocean's Past
Reading the Seafloor Archive
How sediment cores and the shells of foraminifera record the ocean's past
About this unitThe mud of the deep seafloor is an archive that reaches back millions of years. This unit explains how cores are taken, dated, and read, what the oxygen isotope ratio of a foraminiferan shell records, which other proxies trace temperature, water masses, and currents, and how 57 cores were combined into the reference curve of the ice ages.
- The seafloor as an archive
- Coring and drilling
- Dating a core
- Oxygen isotopes
- Palaeothermometers and tracers
- The LR04 stack
The Ocean in the Ice Ages
The orbital cycles, the ice-age ocean, and the carbon dioxide that went into the deep sea
About this unitThe ice ages follow the slow changes of the Earth's orbit, and it was two deep-sea cores that proved it in 1976. This unit computes the three orbital cycles and the sunshine they control, reads the spectrum of a core, follows the switch from a 41,000-year to a 100,000-year rhythm, draws the portrait of the glacial ocean at its coldest, and follows the carbon dioxide that the atmosphere lost in every glacial into the deep sea.
- The discovery of the ice ages
- Orbital cycles and insolation
- The Pacemaker paper
- The Mid-Pleistocene Transition
- The Last Glacial Maximum
- Glacial carbon dioxide
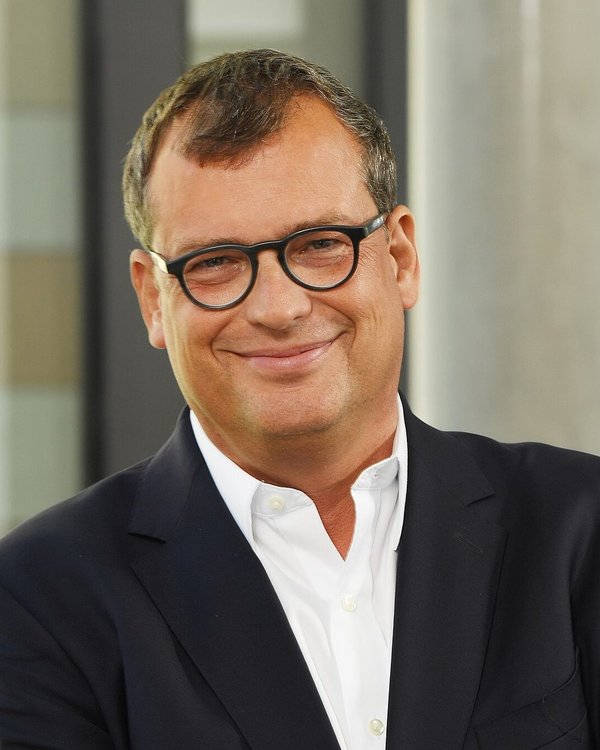 Gerald H. HaugMax Planck Institute for Chemistry, Mainz, and ETH ZurichPalaeoceanography, the ocean's role in the onset of the ice ages and in the glacial carbon cycle
Abrupt Climate Changes and the Ocean
Dansgaard-Oeschger events, Heinrich events, and the stability of the Atlantic overturning
About this unitThe Greenland ice cores showed that the climate of the last ice age jumped by ten degrees within decades, and the ocean cores showed that the Atlantic overturning switched with it. This unit explains the events, the bipolar seesaw, the two-box model with two stable circulations, the Younger Dryas, and the evidence on whether the overturning is weakening today.
- Dansgaard-Oeschger events
- Heinrich events and Pa/Th
- The bipolar seesaw
- Two stable circulations
- The Younger Dryas
- The overturning today
Warm Worlds of the Past
The ocean of the Eocene, the Paleocene-Eocene Thermal Maximum, and the Pliocene as the check on climate models
About this unitSixty-six million years of deep-sea shells record a world that passed from hothouse to icehouse. This unit reads that record, studies the fast carbon release of 56 million years ago and what it did to the chemistry of the ocean, and asks how warm the world was the last time carbon dioxide stood near 400 parts per million, how much higher the sea stood, and what the warm worlds of the past can and cannot say about the next centuries.
- The Cenozoic record
- The Paleocene-Eocene Thermal Maximum
- Ocean acidification in the past
- The Pliocene at 400 ppm
- Models against the past
- Sea level of past warm periods