Image: NASA Goddard Space Flight Center Scientific Visualization Studio
A steady wind does not push the surface water straight ahead. The rotation of the Earth turns it, and the result is the Ekman transport and the gyres that fill every ocean basin. This unit explains the Coriolis effect, the Ekman spiral, the hill of water in the middle of a gyre that satellites measure to the centimetre, and why the Gulf Stream is narrow and fast while the Canary Current is broad and slow.
Sample unit: the complete text
A sailor who has crossed the North Atlantic knows that the water itself moves. Off Florida it runs north at the pace of a brisk walk, and a ship bound for Europe gains a day by riding it; off Portugal it drifts slowly south, and a ship bound for the Caribbean gains by following it. Between the two lies a loop of currents the size of a continent; every other ocean basin holds a loop like it, and this unit explains where the loops come from. The wind sets the surface in motion, the rotation of the Earth turns that motion sideways, water piles up in the middle of each basin, and the pile drives the currents around it. The same reasoning explains why the Gulf Stream is narrow and fast while its counterpart on the other side of the Atlantic is broad and slow, and why a plastic bottle dropped into the sea off Japan is more likely to end up in the middle of the Pacific than on a beach.
1 The wind on the water
When wind blows over the sea, it drags the surface along. The air rubs on the water, small waves roughen the surface and give the air more to push against, and the top layer of water begins to move. Oceanographers measure this push as the wind stress, the force that the wind exerts on each square metre of the sea surface, written as the vector \(\vec{\tau}\) because it has a direction as well as a size. Its unit of measurement is the newton per square metre, which is the pascal, the same unit as pressure, but the stress acts along the surface rather than down into it. It cannot be measured directly over the open sea, so it is computed from the wind speed with a relation found by comparing careful measurements of both.
Because the wind speed enters squared, a wind twice as strong pushes four times as hard. For example, a wind of \(10\unit{m\,s^{-1}}\), which sailors call a fresh breeze, gives a stress of \(1.22\times1.3\times10^{-3}\times100 = 0.16\unit{N\,m^{-2}}\), which is the weight of 16 grams spread over a square metre. Spread over an area the size of a football pitch, about 7,000 square metres, the fresh breeze pushes with a force of 1,100 N, which is the weight of a heavy adult. The wind blows for days over thousands of kilometres, and the push adds up. The steady trade winds exert a stress of about \(0.05\) to \(0.1\unit{N\,m^{-2}}\) over the tropical oceans all year round, and the westerlies of the Southern Ocean reach \(0.2\) to \(0.3\unit{N\,m^{-2}}\).
Measurements with drifting buoys show that the water at the very surface moves at roughly 2 to 3 per cent of the wind speed, so a fresh breeze drives a surface drift of 20 to 30 centimetres per second. What surprised the first people who measured it carefully was the direction. During his Arctic drift of 1893 to 1896, which the excursion in Section 3 describes, Fridtjof Nansen (1861-1930) noticed that the sea ice around his ship moved 20 to 40 degrees to the right of the wind. Water under a steady wind does the same. The reason is the rotation of the Earth, and before the wind-driven currents can be understood, that reason has to be made precise.
2 The Coriolis effect
Unit 4 stated the rule as a principle: seen from the rotating Earth, anything that moves freely over large distances is deflected to the right of its direction of motion in the Northern Hemisphere and to the left in the Southern Hemisphere. Unit 4 also explained one case: air that moves toward the equator falls behind the ground, which moves faster toward the east there, and this turns the trade winds. The same rule applies to water, and this unit needs it as a number.
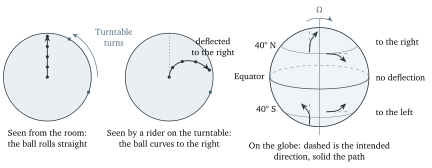
Figure 1 shows the cleanest way to see the deflection. A ball is rolled outward from the centre of a turntable that turns anticlockwise, which is how the Northern Hemisphere turns when seen from above the North Pole. Someone standing in the room sees the ball roll in a straight line, because no force acts on it sideways. Someone riding on the turntable sees the floor turn underneath the ball, and from their point of view the ball curves to the right. Nothing pushed it; the curve appears because the rider’s floor, which is the frame in which the motion is described, is itself turning. On the Earth we are all riders, and we describe the motion of the sea relative to the turning ground, so the water appears deflected. The deflection has the same size whichever way the ball moves, and it applies to motion toward the east or west as well. A parcel of water, which is the small body of water that oceanographers follow as if it moved as one piece, circles the Earth’s axis faster than the ground beneath it when it moves eastward, so it is flung slightly outward from the axis, like a passenger on a roundabout. At mid-latitudes, outward from the axis means partly upward and partly toward the equator, and toward the equator is to the right of an eastward motion.
Figure 1. Left and middle: a ball rolled from the centre of a turntable that turns anticlockwise moves in a straight line for an observer in the room and curves to the right for an observer riding on the turntable; the grey dot on the rim marks the same spot on the turntable in both views. Right: on the rotating Earth, free motion is deflected to the right in the Northern Hemisphere and to the left in the Southern Hemisphere, and not at all on the equator. Dashed arrows show where each parcel was heading, solid arrows the path it follows.
The size of the effect was worked out by Gaspard-Gustave de Coriolis (1792-1843) in 1835 for machines with rotating parts, long before anyone applied it to the sea. For motion along the Earth’s surface, the result is an acceleration at right angles to the velocity whose size is the speed of the motion multiplied by a number that depends only on the latitude.
Two things about this acceleration decide the rest of the unit. First, it is tiny: a current of \(0.2\unit{m\,s^{-1}}\) at 45° N feels \(a_{\mathrm{C}} = 1.03\times10^{-4}\times0.2 = 2\times10^{-5}\unit{m\,s^{-2}}\), which is only two millionths of the acceleration of gravity, and that is why nobody notices it when draining a bath, whatever the popular story says. Second, it never stops, and a sideways push that lasts a day turns even a slow current right round, so any motion in the sea that lasts longer than a few hours has to be described with \(f\) in the equations. The deflection is often called the Coriolis force, and this unit uses that name when it sets forces against each other, but no agent pushes the water; the force appears only because we measure motion against a turning Earth.
3 Ekman’s answer
Nansen’s observation that ice drifts to the right of the wind went to a physicist, and the physicist’s answer became the first equation of ocean dynamics.
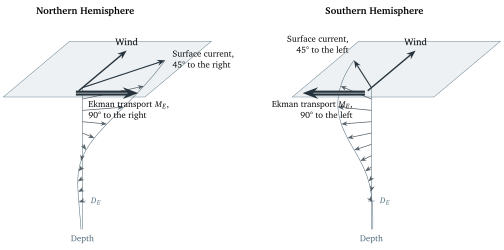
Ekman considered the simplest possible case: a steady wind blowing over a deep ocean of uniform density, far from any coast, in which each layer of water drags the layer below it with a friction that is the same at every depth. He asked what steady flow results when the wind stress at the top, the friction between the layers, and the Coriolis force on every layer are in balance. The answer is in Figure 2 and in the following principles.
Figure 2. The Ekman spiral for a wind blowing toward the top of the page, drawn from Ekman’s solution. Each arrow is the current at one depth, from the surface down to the Ekman depth \(D_E\) in steps of one tenth of \(D_E\); the grey curve joins their tips. The surface current is turned 45° from the wind, the deeper currents are turned further and are weaker, and the transport of the whole layer (the thick arrow on the surface plane) is at right angles to the wind. The Southern Hemisphere is the mirror image.
The third principle is the one that matters most, and it can be understood without the spiral. Take the whole wind-driven layer as one slab of water. The wind pushes the slab along the wind direction. The slab moves, so the Coriolis force acts on it, at right angles to its motion. In a steady state the two must cancel, which fixes both the direction and the amount of the motion.
Real winds are not steady and the real ocean is not uniform, so the clean spiral is hard to find in measurements, and the surface current is usually turned less than 45° from the wind, because the mixed layer stirs the momentum downward faster than Ekman’s uniform friction allows. The transport, which does not depend on the friction, holds up well: in 1987 James Price and colleagues at the Woods Hole Oceanographic Institution in Massachusetts measured the currents under a mooring in the Sargasso Sea closely enough to see the spiral turn with depth and to confirm that the transport matched the wind stress.
4 The hill in the middle of the ocean
Now put the Ekman transport under the real winds of Unit 4. Over the subtropical North Atlantic the trade winds blow toward the west between about 10 and 25° N, and the westerlies blow toward the east between about 35 and 55° N. The Ekman transport is to the right of each: northward under the trades, southward under the westerlies. Both push surface water toward the belt between them, around 30° N. The water converges there, and water that converges at the surface has nowhere to go but down. This slow downward motion, called Ekman pumping, is only tens of metres per year, but it pushes the warm surface layer downward and makes the thermocline of Unit 3 deepest in the middle of the subtropical gyres, several hundred metres below the surface.
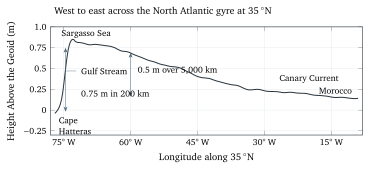
Warm water takes up more room than the same mass of cold water, so a column of the sea with a thick warm layer stands a little taller than one without, and the sea surface is higher where the warm layer is thick; the converging water adds to the pile directly. The middle of the subtropical North Atlantic is, quite literally, about one metre higher than its edges. Figure 3 shows the height of the sea surface across the gyre as measured from space, and it has the shape of a broad hill with one side much steeper than the other: from the coast of Morocco the surface rises by half a metre over 5,000 km to a crest in the Sargasso Sea, just outside the Gulf Stream, and then falls by three quarters of a metre within 200 km at the western edge, where the Gulf Stream runs.
Figure 3. The mean height of the sea surface above the geoid from west to east across the North Atlantic subtropical gyre along 35° N, from the DTU22 mean dynamic topography of DTU Space, which combines two decades of satellite altimetry (1993 to 2012) with a satellite gravity model. The gentle eastern slope and the steep western slope across the Gulf Stream are the two sides of the hill; the heights are relative to the surface the sea would have if it were at rest.
How a satellite measures a hill a metre high on an ocean 5,000 km wide deserves a paragraph. A radar altimeter sends pulses straight down and times their return, which gives the distance to the sea to within about 2 cm, and the satellite’s own position is known to a similar precision from laser ranging and satellite navigation. Subtracting one from the other gives the height of the sea surface above a reference ellipsoid, the smooth mathematical shape that stands in for the Earth, and that height is dominated by something that has nothing to do with currents: the uneven pull of gravity, which raises the resting sea surface by tens of metres over regions of dense rock and lowers it elsewhere. This resting surface is called the geoid; it has bumps a hundred times larger than the hill of a gyre, and it was measured separately by the gravity satellites GRACE (2002 to 2017) and GOCE (2009 to 2013). What remains after the geoid is subtracted is the dynamic topography, the part of the sea surface shaped by the motion of the water, which is what Figure 3 shows. The first altimeter accurate enough for this, TOPEX/Poseidon, was launched by NASA and the French space agency CNES on 10 August 1992, and its successors have measured the sea surface without a gap since.
A hill of water does what any hill of fluid does: it presses outward. The water under the crest is deeper than the water at the edge, so the pressure at any depth is higher under the crest, and the difference pushes the water from the high side toward the low side.
Where the sea surface height \(\eta\) changes by \(\Delta\eta\) over a horizontal distance \(\Delta x\), every parcel of water below feels an acceleration \(g\,\Delta\eta/\Delta x\) down the slope, which is \(g\) times the slope. The reason is that the extra water on the high side weighs \(\rho g\,\Delta\eta\) more per square metre, and that extra weight pushes on a column of water of length \(\Delta x\) whose mass is \(\rho\,\Delta x\) per square metre of its cross-section; force divided by mass gives \(g\,\Delta\eta/\Delta x\). What happens when the water starts to move downhill is the same thing that happened to the ball on the turntable. The downhill motion is deflected to the right, and keeps being deflected, until the water flows along the slope rather than down it, with the hill on its right hand in the Northern Hemisphere. Then the pressure force, pointing downhill, and the Coriolis force, pointing to the right of the flow, which is uphill, are opposite and equal, and the flow is steady. Such a current is called geostrophic, from the Greek for Earth and turning.
The hill and the geostrophic principle together explain the shape of every subtropical gyre. Ekman convergence builds a hill between the trades and the westerlies, and the geostrophic flow around it runs clockwise in the Northern Hemisphere: westward on the equatorial side, poleward on the western side, eastward on the poleward side, and equatorward on the eastern side. In the Southern Hemisphere the Ekman transport is to the left of the wind, so the convergence still builds a hill between the trades and the westerlies, but the flow around it runs anticlockwise. Both are the same thing physically: a hill with the high water on the side to which the Coriolis effect deflects.
5 The five great gyres
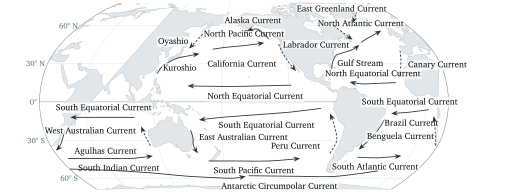
Figure 4 shows the result on a map. Each of the five subtropical basins holds a subtropical gyre, a closed loop of currents centred near 30° of latitude, turning clockwise in the Northern Hemisphere and anticlockwise in the Southern Hemisphere, and each loop is made of four named currents, listed in Table 1. On the western side a western boundary current carries warm tropical water poleward in a narrow, fast, deep stream. On the poleward side a broad drift carries it eastward across the basin. On the eastern side an eastern boundary current carries cooler water slowly back toward the equator in a band hundreds of kilometres wide, and on the equatorial side the trade winds drive the North or South Equatorial Current westward to close the loop. The two boundary currents are the warm and cold sides of each basin in the sea surface temperature map of Unit 4.
Gyre
Turns
Western Boundary Current
Eastern Boundary Current
North Atlantic
clockwise
Gulf Stream
Canary Current
South Atlantic
anticlockwise
Brazil Current
Benguela Current
North Pacific
clockwise
Kuroshio
California Current
South Pacific
anticlockwise
East Australian Current
Peru Current
Indian Ocean
anticlockwise
Agulhas Current
West Australian Current
Table 1. The five subtropical gyres with their boundary currents. The poleward sides are the North Atlantic, South Atlantic, North Pacific, South Pacific, and South Indian Currents, the equatorward sides the North and South Equatorial Currents of each basin; the Peru Current is also called the Humboldt Current.
Poleward of the westerlies the pattern reverses: between about 50 and 65° N the Ekman transports under the westerlies and the polar easterlies pull the surface water apart, the sea surface is a hollow rather than a hill, and the geostrophic flow around the hollow is anticlockwise. These are the subpolar gyres, one in the North Atlantic between Greenland, Labrador, and Scotland, with the cold Labrador and East Greenland Currents on its western side, and one in the North Pacific between Alaska and Kamchatka, with the cold Oyashio. In the Southern Hemisphere no continents stand in the way at these latitudes, and instead of a subpolar gyre the westerlies drive the Antarctic Circumpolar Current round the whole Earth, carrying about \(130\) to \(170\unit{Sv}\) through Drake Passage, the strait between South America and Antarctica, which is more than any other current carries. The deep water that forms in the subpolar seas is the subject of Unit 8.
Figure 4. The surface currents of the world ocean on a Robinson projection with the Pacific in the centre, drawn after the standard descriptions of the circulation. Solid arrows are warm currents, dashed arrows cold currents. The five subtropical gyres fill the Pacific, Atlantic, and Indian Ocean basins between about 10 and 45° of latitude; the subpolar gyres of the North Atlantic and the North Pacific turn the other way, and the Antarctic Circumpolar Current runs unbroken around the globe. Coastlines from Natural Earth.Figure 5. The Franklin and Folger chart of the Gulf Stream in the version engraved by James Poupard for the Transactions of the American Philosophical Society in 1786. The stream is the dark band from the Straits of Florida along the American coast and out past Newfoundland; Franklin’s remarks on how to avoid it are printed on the left. Credit: Library of Congress, Geography and Map Division, public domain.
5.1 The currents of the equator
Near the equator the simple picture needs two additions. The trade winds of both hemispheres drive the North Equatorial Current and the South Equatorial Current westward across each ocean, and between them, under the belt of light winds a few degrees north of the equator, the Equatorial Countercurrent flows east, against the trade winds on either side. Harald Sverdrup (1888-1957) explained it in 1947 as a consequence of the way the wind stress changes with latitude across the doldrums, as Unit 4 called that belt of light winds, in the theory that Section 6 takes up. In outline, the trade winds are weak in the doldrums and strong on either side, so the Ekman transports pile the sea surface into a low ridge on the equatorward side of the belt and pull a shallow trough on its poleward side, and the geostrophic flow between a ridge to the south and a trough to the north runs eastward.
The second addition was a surprise. In 1952 Townsend Cromwell (1922-1958), surveying tuna grounds in the central Pacific for the United States Fish and Wildlife Service, noticed that fishing gear lowered below the westward surface current was carried eastward. He had found the Equatorial Undercurrent, a ribbon of water about 300 km wide and 200 m thick, centred on the equator at a depth of around 100 m and flowing east at up to \(1.5\unit{m\,s^{-1}}\). It exists because the trade winds pile warm water up in the west, so the sea surface slopes down toward the east and presses the water eastward at depth; away from the equator this pressure force would be turned into a geostrophic current along the slope, but on the equator \(f = 0\) and nothing turns it, so the water runs downhill toward the east beneath the layer that the wind drags west.
6 Why the western side is different
Table 1 hides the most striking fact about the gyres: the western boundary currents are nothing like their eastern counterparts. The Gulf Stream off Cape Hatteras is about 100 km wide, flows at up to \(2\unit{m\,s^{-1}}\) at the surface, reaches more than 1,000 m down, and carries about \(90\unit{Sv}\). The Canary Current on the other side of the same gyre is nearly 1,000 km wide, flows at a few centimetres per second, and carries a few sverdrups in its upper layers. The Kuroshio south of Japan carries about \(42\unit{Sv}\) according to repeated measurements along a section south of Shikoku combined with satellite altimetry, while the California Current on the far side of the Pacific carries roughly \(10\unit{Sv}\) in a band almost 1,000 km wide; the Agulhas Current off South Africa, at about \(70\unit{Sv}\), is the strongest of the Southern Hemisphere. In every basin the return flow toward the pole is squeezed into a narrow, fast jet against the western coast, while the flow toward the equator spreads across the rest of the basin. Oceanographers call this western intensification.
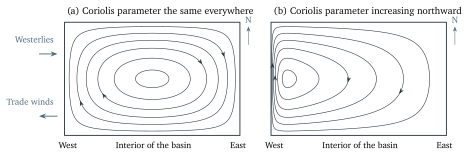
The explanation came in 1948 from Henry Stommel (1920-1992), then a young researcher at Woods Hole, in a paper of five pages. He built the simplest model ocean that could have a gyre at all, a rectangular basin of uniform depth driven by westerlies along its northern edge and trade winds along its southern edge and slowed by friction at the sea floor, and solved it three times. With no rotation and with a rotation whose Coriolis parameter was the same everywhere, the gyre came out symmetric, as in Figure 6(a). With a Coriolis parameter that grew with latitude, as it does on the real Earth, the whole return flow crowded against the western wall, as in Figure 6(b). The cause was the change of \(f\) with latitude, which oceanographers write as \(\beta = \Delta f/\Delta y\), the increase of the Coriolis parameter per metre northward, about \(2\times10^{-11}\unit{m^{-1}\,s^{-1}}\) at mid-latitudes. The reason it matters can be told in words, with the idea of spin.
Figure 6. Streamlines of the wind-driven circulation in Stommel’s rectangular model ocean, computed from his 1948 solution and drawn at equal intervals of transport, so that closely spaced lines mean a fast current. (a) With a Coriolis parameter that is the same everywhere the gyre is symmetric. (b) With a Coriolis parameter that increases northward, as on the real Earth, the poleward return flow is pressed against the western wall into a narrow, fast current, while the rest of the basin drifts slowly toward the equator. The arrows give the sense of the flow for a Northern Hemisphere gyre.
Two years later Walter Munk (1917-2019) replaced Stommel’s bottom friction with friction between neighbouring currents, drove the model with the real winds of the Pacific, and recovered the Kuroshio, the North Pacific Current, the California Current, and the equatorial currents in roughly their observed positions. The western intensification survives in both models, and in every model since, because it does not depend on the kind of friction; it depends on \(\beta\). The interior drift that Stommel’s argument needs had been worked out the year before by Sverdrup, in the paper that explained the Equatorial Countercurrent: away from the boundary currents, the north-south transport of the whole water column is set by the way the wind stress changes from place to place, and by nothing else.
7 What drifts on the surface
The cleanest way to see the surface currents is to drop something into the sea and follow it, and the Global Drifter Program of the United States National Oceanic and Atmospheric Administration has done this on purpose since 1979: about 1,300 surface drifters are at sea at any time, each a small float with a cloth drogue, a kind of underwater parachute, hanging 15 m below it, so that it follows the water at that depth rather than the wind, reporting its position by satellite several times a day. Their tracks give the map of the mean surface circulation that the arrows of Figure 4 summarize, and they show that a drifter rarely goes round a gyre in a tidy loop; it wanders, loops in eddies for weeks, and crosses a basin along a path that no other drifter shares.
The ocean has also run the experiment by accident. On 10 January 1992 a container ship on the way from Hong Kong to Tacoma lost twelve containers in a storm near 45° N, 178° E, in the middle of the North Pacific. One of them broke open and released 28,800 plastic bath toys (yellow ducks, blue turtles, green frogs, and red beavers), all of which float. In November 1992, ten months later, the first of them came ashore near Sitka in Alaska, 3,500 km to the east along the North Pacific Current and the Alaska Current, and the oceanographer Curtis Ebbesmeyer and his colleague James Ingraham used the landings, reported by people who search the beaches, to check a computer model of the surface currents built from wind data and drifter tracks; when the model was started at the spill site on the day of the storm, it put the toys at Sitka in the right month.
Floating things also collect in the middle of the gyres, and the reason is the Ekman convergence of Section 4. The surface water of the subtropics is pushed toward the centre of each gyre from both sides, and when it arrives there it sinks slowly, at tens of metres per year, as Ekman pumping. Anything that floats cannot follow the water down. It stays at the surface, and the next parcel of converging water carries it a little further in, so over years floating debris from all around a basin drifts toward the convergence and accumulates there. Five such accumulation zones exist, one in each subtropical gyre, and the largest, in the North Pacific between Hawaii and California, is usually called the Great Pacific Garbage Patch. A survey published in 2018 by Laurent Lebreton and colleagues, who towed nets and flew aircraft across it, estimated that it covers about 1.6 million square kilometres, which is about three times the area of France, and holds at least 79,000 tonnes of plastic. Even so, the name misleads: there is no island of rubbish and nothing to see from a ship’s deck, because the plastic is mostly in fragments of a few millimetres. The survey’s net tows caught on average less than one piece per square metre, and across the gyres as a whole the review of the research spotlight below gives about one piece per four square metres as typical, rising to one to ten per square metre in the most polluted water; it is the size of the area that makes the tonnage.
This is one of 16 units
Participants also get the quiz, the further reading, and the final exam.