

Seawater Chemistry and the Ocean Carbon Cycle
The ocean holds about forty times more carbon than the atmosphere, almost all of it as bicarbonate. This unit explains the dissolved gases and nutrients and what their profiles reveal about the age of deep water, the carbonate system that buffers the pH of the sea, the solubility and biological pumps, where shells dissolve, and how the ocean's uptake of a quarter of human carbon dioxide emissions is measured and what it does to the chemistry of the surface sea.
Every litre of seawater carries some fifteen millilitres of dissolved gas and about thirty milligrams of dissolved carbon, amounts so small that the earlier units could ignore them when they weighed the water. Yet the deep sea breathes with that gas, the ocean’s store of carbon is some forty times that of the atmosphere, and the same chemistry decides whether a shell of calcium carbonate survives on the seafloor. This unit follows the gases and the carbon from the surface, where they enter, to the deep water, where they accumulate, and ends with what the uptake of human carbon dioxide is doing to the sea.
1 The dissolved gases
Air dissolves in water. Unit 4 stated the rule, Henry’s law, which says that at equilibrium the concentration of a dissolved gas is proportional to its partial pressure in the air above, with a solubility constant that falls as the water warms. For oxygen the equilibrium concentration in seawater of salinity 35 is about \(350\unit{\mu mol\,kg^{-1}}\) at 0 ° C and about \(210\unit{\mu mol\,kg^{-1}}\) at 25 ° C (a micromole, \(1\unit{\mu mol}\), is a millionth of a mole, and since a mole of \(\mathrm{O_2}\) weighs 32 g, \(200\unit{\mu mol\,kg^{-1}}\) of oxygen is \(6.4\unit{mg}\) per kilogram, about 4.6 mL of gas per litre). Oxygen and carbon dioxide, unlike nitrogen, are consumed and produced by living things, and the departures from equilibrium are where the information lies.
A water sample at the surface holds about as much oxygen as Henry’s law predicts for its temperature, and in a spring bloom a little more, because photosynthesis then adds oxygen faster than the wind can carry the surplus away. Once the water sinks below the surface it is cut off from the air, and from then on its oxygen can only fall. Sinking organic particles are eaten and respired by bacteria and animals on the way down, and every atom of organic carbon that is respired takes a little more than one molecule of oxygen with it. Figure 1 shows the result at two places in the subtropical ocean, drawn from the GLODAP climatology, a compilation of the water-column chemistry measured on research cruises between 1972 and 2013. At both places the oxygen is near saturation at the surface, falls steeply through the upper few hundred metres, reaches a minimum between 500 and 1,000 m, and recovers below. The minimum is deeper than the main thermocline because respiration continues all the way down while the oxygen supply from above has stopped; the recovery below comes from the deep water, which was at the surface in the polar seas more recently than the water above it and brought its oxygen with it. Unit 8 follows that deep water on its way.
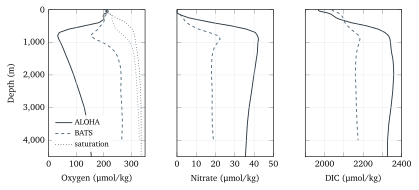
The two profiles also differ from each other, in a way that is repeated at every depth across the world ocean. The deep Pacific has less oxygen than the deep Atlantic at the same depth, about 130 against about 265 \(\unit{\mu mol\,kg^{-1}}\) at 3,000 m, and this is because the deep Pacific water has been away from the surface for longer. The oxygen deficit of a sample is called its apparent oxygen utilization, abbreviated AOU, and it serves as a kind of clock, because the longer a parcel of water has been below the surface, the more oxygen the bacteria and animals it carries have used. A second clock is radiocarbon, \(^{14}\mathrm{C}\), which comes in two forms. The natural isotope decays slowly in water that is cut off from the air, and Unit 8 uses it to date the deep water. The nuclear weapon tests of the 1950s and 1960s added a spike of radiocarbon to the atmosphere, which oceanographers watched sink into the sea over the following decades; its uses in dating lie beyond this masterclass.