

Warm Worlds of the Past
Sixty-six million years of deep-sea shells record a world that passed from hothouse to icehouse. This unit reads that record, studies the fast carbon release of 56 million years ago and what it did to the chemistry of the ocean, and asks how warm the world was the last time carbon dioxide stood near 400 parts per million, how much higher the sea stood, and what the warm worlds of the past can and cannot say about the next centuries.
The three units before this one read the ocean of the ice ages, a world colder than ours. The questions of the next centuries point the other way. Carbon dioxide stood at about 423 parts per million in 2024, a value the Earth last saw about three million years ago, and if emissions continue the atmosphere will reach concentrations last seen tens of millions of years ago. The seafloor archive of Unit 13 holds those warmer worlds too, and this unit reads three of them: the 66 million years of the Cenozoic era in one curve, the fast carbon release of 56 million years ago, and the Pliocene epoch, when the carbon dioxide was close to today’s and the sea stood higher. Each answers a different question about the future, and each has a limit to what it can say.
1 Sixty-six million years in one curve
Unit 13 ended with the LR04 stack, 5.3 million years of benthic \(\delta^{18}\mathrm{O}\) assembled from 57 cores. The same kind of record can be pushed back to the asteroid impact that ended the Cretaceous period 66 million years ago, because the deep sea has been inhabited by shell-building benthic foraminifera for the whole of the time since. In 1975 Nicholas Shackleton (1937-2006) and James Kennett published one of the first such records, from a few drill cores south of New Zealand, and it already showed a world that had passed from warm to cold. The best version today is the CENOGRID reference curve, published in 2020 by Thomas Westerhold and 23 co-authors, which splices 14 drilling records into one astronomically dated series from 66 million years ago to the present (Figure 1). In this unit the abbreviation Ma stands for million years ago.
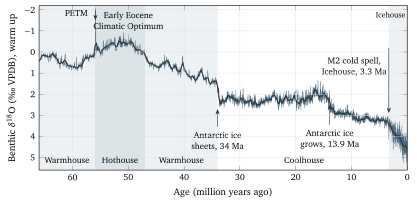
Reading the curve needs one reminder from Unit 13. A benthic shell records two things at once, the temperature of the deep water and the \(\delta^{18}\mathrm{O}\) of the water itself, which rises when ice sheets grow. Before 34 Ma there were no large ice sheets, so the curve in its left part is almost pure temperature, and the palaeotemperature equation of Unit 13 can be applied directly, as the first worked example shows. After 34 Ma the two effects mix, and a step in the curve can be ice, cooling, or both; separating them needs the independent thermometers of Unit 13, which is how the arrows in Figure 1 were placed.
Westerhold and his colleagues used a statistical method called recurrence analysis to divide the curve into stretches with the same behaviour, and they found four climate states, which they named the Hothouse, the Warmhouse, the Coolhouse, and the Icehouse. The Warmhouse ran from 66 to 56 Ma and again from 47 to 34 Ma, with global temperatures more than 5 °C above today’s and no ice sheets; the Hothouse filled the time between, from the Paleocene-Eocene Thermal Maximum at 56 Ma to the end of the Early Eocene Climatic Optimum at 47 Ma, more than 10 °C warmer than today (a 2020 compilation by Gordon Inglis and colleagues puts the Early Eocene Climatic Optimum at 10 to 16 °C above pre-industrial), with the largest swings and with repeated short warmings, called hyperthermals, of which the PETM is the first and largest. The Coolhouse began at the Eocene-Oligocene transition near 34 Ma, when large ice sheets first grew on Antarctica, and it carries a second step at 13.9 Ma when that ice expanded again; between the two steps lies the Miocene Climatic Optimum of about 17 to 14 Ma, the last time the Earth was clearly warmer than today for millions of years. The Icehouse, the state of the ice ages of Units 14 and 15, is the youngest, and the paper puts its beginning at a cold spell called marine isotope stage M2 at 3.3 Ma.