 Image: European Space Agency (Attribution)
The last time carbon dioxide was at 400 ppm
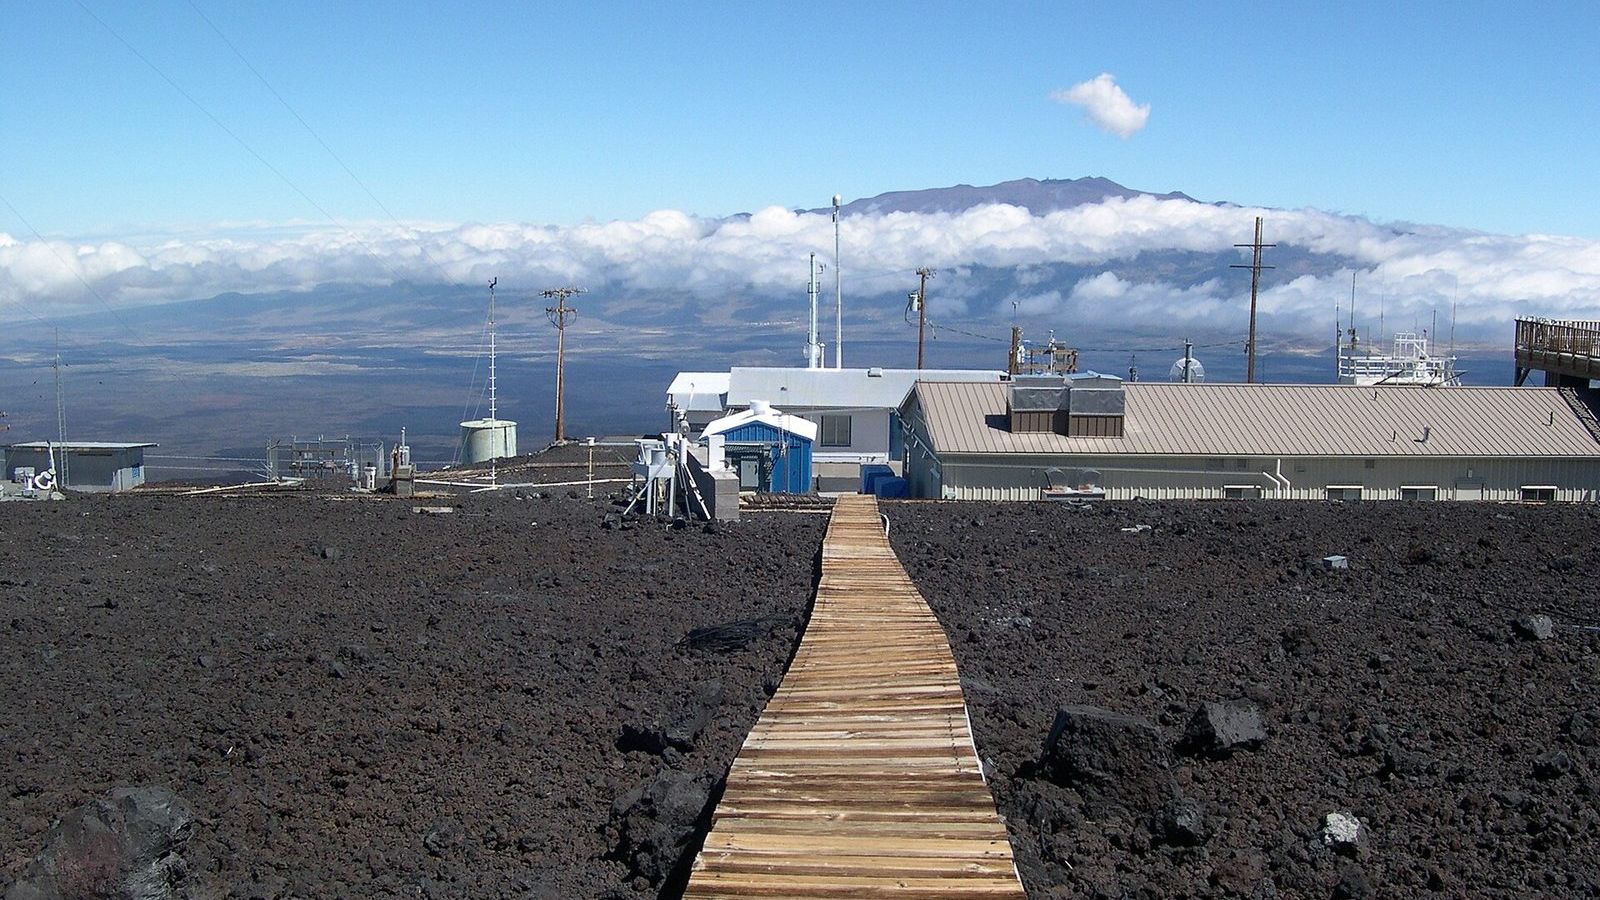
On 9 May 2013 the daily average concentration of carbon dioxide measured at the Mauna Loa Observatory in Hawaii passed 400 parts per million for the first time. The monthly average followed in 2014 and the annual average in 2015, and the number has since risen to about 425 ppm. The record kept by NOAA goes back to 1958, when Charles David Keeling began measuring and found 315 ppm; the ice cores extend it back 800,000 years and never show more than 300 ppm. To find a world with 400 ppm you have to go back about three million years, to the Pliocene epoch, before the ice ages began, and the ocean of that world is the nearest thing we have to a picture of where the climate is heading.
What the Pliocene was like
The interval that palaeoclimatologists use is the mid-Piacenzian warm period, from 3.3 to 3.0 million years ago, chosen because it is recent enough that the continents and ocean basins were almost where they are now, and warm enough to be interesting. The best estimates of its carbon dioxide, from the boron isotopes in foraminifera shells and from the carbon isotopes of alkenones, lie between about 350 and 450 ppm, with the middle of the range close to today's value. The global mean surface temperature was 2.5 to 4 °C higher than before the industrial era, and the warming was far from even: the tropics were about as warm as now, while the high latitudes were much warmer, with sea surface temperatures in the North Atlantic several degrees above today's and forests growing on the Arctic coast of Canada where there is now tundra. Greenland had little or no ice sheet. The Arctic Ocean may have been free of sea ice in summer. The Antarctic ice sheet existed but was smaller, with the parts of it that sit on bedrock below sea level, in West Antarctica and in the Wilkes and Aurora basins of East Antarctica, reduced or gone.
The sea level, and why it is disputed
The sea level of the Pliocene is the number everyone wants and the one least agreed. If Greenland and West Antarctica were gone, the sea would stand about 12 m higher, and the marine basins of East Antarctica could add another 10 m or more. The geological evidence is of two kinds, and both are hard to read. Ancient shorelines on the coasts of South Africa, Australia, and the eastern United States, and in caves in Mallorca, stand 10 to 30 m above today's sea, but three million years is long enough for the land itself to have risen or sunk by that much, and the corrections for the slow flow of the mantle under the vanished ice sheets are large and uncertain. The oxygen isotopes of deep-sea shells, which record the volume of ice, give a smaller number, around 10 to 20 m, with their own uncertainty from the temperature of the deep water. The Intergovernmental Panel on Climate Change in 2021 gave the Pliocene sea level as 5 to 25 m above the present, and that width is an honest statement of what is known. Even the low end means that the Pliocene ocean had swallowed much of what the ice sheets now hold.
Testing the models against it
A climate model that is used to project the next century should be able to reproduce a past climate whose forcing is known, and the Pliocene is the test for the warm side. The Pliocene Model Intercomparison Project, in its second phase led by Alan Haywood of the University of Leeds, ran sixteen climate models with the Pliocene's geography, ice sheets, and vegetation and a carbon dioxide level of 400 ppm, and compared the results with the reconstructed temperatures. The results, published in 2020, gave a global warming of 3.2 °C on average across the models, with a range from 1.7 to 5.2 °C, and the models that matched the reconstructed sea surface temperatures best were those in the warmer half. The models also reproduced the pattern, with the strongest warming at high latitudes, though most of them still warmed the North Atlantic less than the shells say it warmed.
The same exercise says something about the climate sensitivity, the warming the Earth settles into when carbon dioxide is doubled. The models' Pliocene warming per unit of forcing was about two thirds higher than their fast sensitivity, because in the Pliocene the slow parts of the system, the ice sheets and the vegetation, had had time to respond. Here is the sum in its simplest form. A sensitivity of 3 °C per doubling gives, for a rise from 280 to 400 ppm, a warming of \(3 \times \log_2(400/280) = 3 \times 0.51 = 1.5\) °C once the ocean has caught up, which is about where the world is now. The Pliocene at the same carbon dioxide was 2.5 to 4 °C warmer. The difference is the slow feedbacks that have not happened yet: the ice that has not melted, the forests that have not moved, the ocean that has not finished warming. The Pliocene is not a forecast for 2100; it is a statement of where 400 ppm leads if it is held for a few thousand years.
What the analogue cannot do
The Pliocene world differed from ours in ways that are not about carbon dioxide. The Central American seaway may still have been partly open, which would have changed the Atlantic circulation; the Bering Strait, the Indonesian passages, and the height of several mountain ranges were different; and the Sun was very slightly fainter. The carbon dioxide itself rose and fell over tens of thousands of years, not a century, so the ocean and the ice were always close to balance with it, which they are not now. And the Pliocene, for all its warmth, was a world with ice ages of a milder kind, paced by the same orbital rhythms as ours. Palaeoceanographers use it the way an engineer uses a test rig: not because it is the real thing, but because it is the only version of the experiment that has already been run.
Unit 16 of the Ocean Masterclass covers the 66-million-year record, the Paleocene-Eocene Thermal Maximum, the Pliocene and its sea level as a disputed value, the model comparison in a research spotlight, and the sensitivity calculation worked through. The full list of units is in the curriculum.