 Image: NASA Jet Propulsion Laboratory / NASA/JPL-Caltech (Public domain)
What El Niño actually is
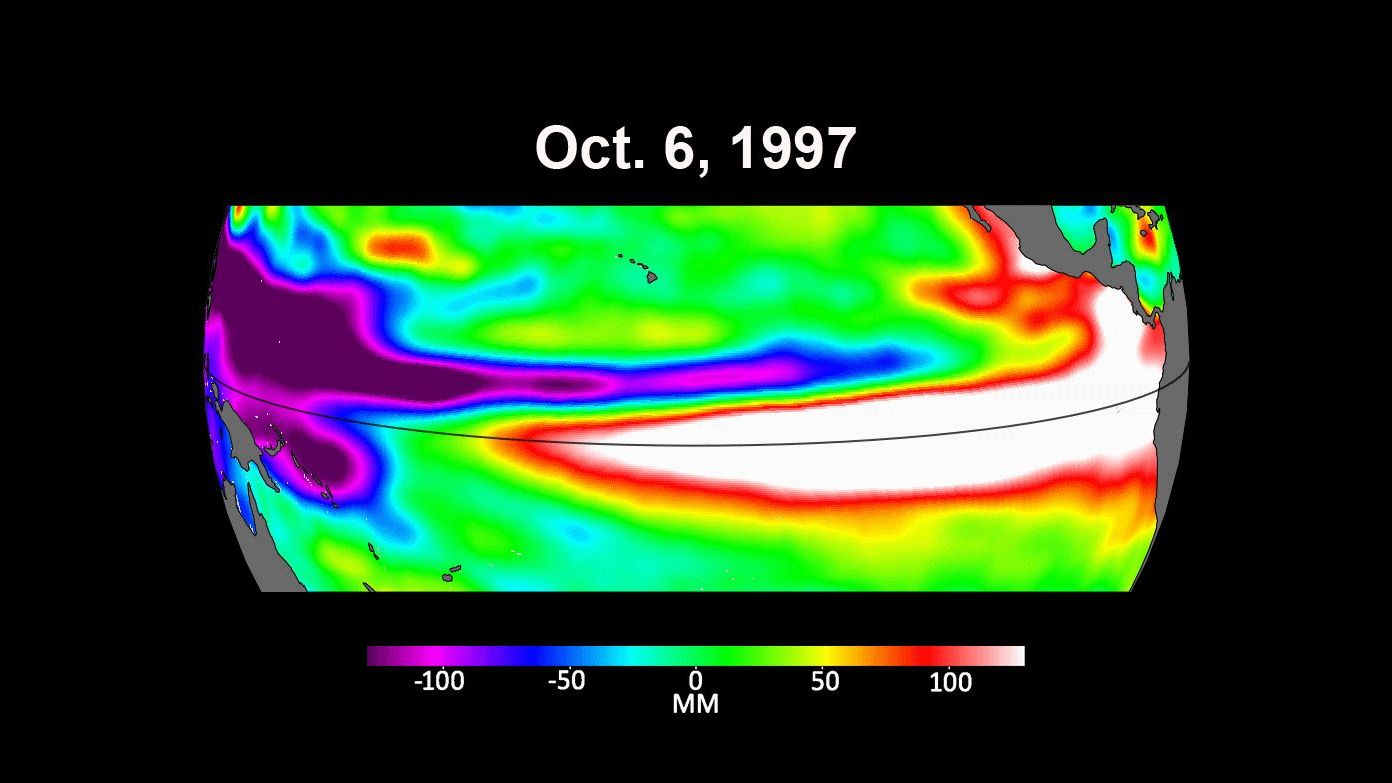
Fishermen on the coast of Peru gave the name. Around Christmas in some years a warm current arrived from the north, the anchovies vanished, and the rains came to a desert coast, and they called it El Niño, the Christ child, for the season. The name is now attached to something much larger: a shift in the whole tropical Pacific, 15,000 km across, that happens every two to seven years, lasts about a year, and changes the weather from Indonesia to California. It is the largest year-to-year swing in the climate system, and it is, at bottom, a piece of ocean physics.
The normal Pacific
Start with the ordinary state. The trade winds blow from east to west along the equator and push the warm surface water ahead of them, so that it piles up in the west. The western Pacific around Indonesia has the warmest open-ocean water on Earth, about 29 °C, in a layer 150 m thick; the sea surface there stands about half a metre higher than off South America. In the east, off Peru and Ecuador, the warm layer is only 50 m thick, and the wind that blows offshore and along the coast pulls cold water up from below, the cold tongue, at about 23 °C. The boundary between the warm layer and the cold water beneath, the thermocline, therefore slopes: deep in the west, shallow in the east. The warm water in the west heats the air above it, which rises, rains, and flows back east aloft to sink over the cool eastern Pacific, a loop that Jacob Bjerknes named the Walker circulation. The surface branch of that loop is the trade wind. The wind makes the tilt, and the tilt makes the wind.
The feedback
Bjerknes saw in 1969 that this arrangement can run away. Suppose the trade winds weaken a little. Less warm water is pushed west, the thermocline in the east deepens, less cold water reaches the surface, and the eastern Pacific warms. A warmer east means a smaller temperature difference across the basin, a weaker Walker circulation, and so weaker trade winds, which was where we started. A small push grows. Run it the other way and stronger trades make a colder east, a stronger Walker cell, and stronger trades, which is La Niña. The loop is called the Bjerknes feedback, and it is why the tropical Pacific does not sit quietly at its mean state.
The ocean's memory
A feedback that only amplifies would stick at one extreme. What turns El Niño off, and sets its rhythm, is the slow response of the ocean. When the wind over the western Pacific slackens, or reverses in a burst of westerlies, the warm water that was held in the west is released, and it travels east along the equator as a wave in the thermocline, an equatorial Kelvin wave. Its speed is set by the density difference across the thermocline and the depth of the warm layer, \(c = \sqrt{g' H}\), with the reduced gravity \(g'\) about \(0.03\) m/s² and \(H\) about 200 m; that gives about 2.5 m/s. At 2.5 m/s the wave takes \(15{,}000{,}000 / 2.5\) seconds, about 70 days, to cross the Pacific. The TAO moorings along the equator watched exactly this in the spring of 1997: the 20 °C isotherm, which marks the thermocline, deepened at 165° E in March, at 140° W in April, and at 110° W in May, and the warm water arrived off Peru that summer. The Kelvin wave deepens the eastern thermocline and warms the east; that is the El Niño.
The same wind change also sends slower waves, Rossby waves, westward away from the equator; they reflect from the western boundary and return along the equator as Kelvin waves of the opposite sign months later, lifting the thermocline back up. Meanwhile the warm layer as a whole has been drained of heat towards the poles. Both effects end the event after about a year and tip the system towards La Niña. The two to seven year spacing comes from how long it takes the warm water to build up again, and the irregularity comes from the weather: the westerly wind bursts that trigger events are random.
How it is measured
The standard index is Niño 3.4, the sea surface temperature anomaly averaged over the box from 5° N to 5° S and from 170° W to 120° W, in the central Pacific. Its three-month running mean is the Oceanic Niño Index, and an El Niño is declared when the index stays above +0.5 °C for five overlapping three-month seasons; La Niña when it stays below −0.5 °C. The great events stand out: the index peaked at +2.4 °C in the winter of 1997 to 1998, at +2.6 °C in 2015 to 2016, and at about +2.0 °C in 2023 to 2024. The Southern Oscillation Index, the older measure, is the pressure difference between Tahiti and Darwin; it falls when El Niño comes, because the high pressure of the eastern Pacific weakens as the water beneath it warms. Gilbert Walker found that seesaw in the 1920s from pressure records while trying to forecast the Indian monsoon, and he never knew that the ocean was behind it.
Why it matters far away
The rainfall of the tropics follows the warmest water. In an El Niño the rain that normally falls over Indonesia and northern Australia moves east into the central Pacific, which brings drought and fires to the west and floods to Peru. The heating of the atmosphere over the central Pacific launches waves into the jet streams that shift the winter storm tracks of North America south, suppress Atlantic hurricanes by increasing the wind shear over the tropical Atlantic, and warm the global average temperature by a tenth of a degree or more, which is why record warm years tend to be El Niño years. The forecasts have become good. A model run in July can say with some confidence what the winter will bring; one run in March usually cannot, because the spring is when the system is most easily knocked off course. Forecasters call this the spring predictability barrier, and it has not gone away.
You can watch the next one arrive. The NOAA data display for the equatorial moorings plots the depth of the 20 °C isotherm for any year you choose; plot 1997 first, then this year.
Unit 11 of the Ocean Masterclass works through the Walker circulation, the Bjerknes feedback, the Kelvin and Rossby waves, the indices, and the forecasting of the 2015 to 2016 event, with an interactive feedback loop. The full list of units is in the curriculum.