 Image: NASA/JPL-Caltech (Public domain)
How a satellite measures a current it cannot see
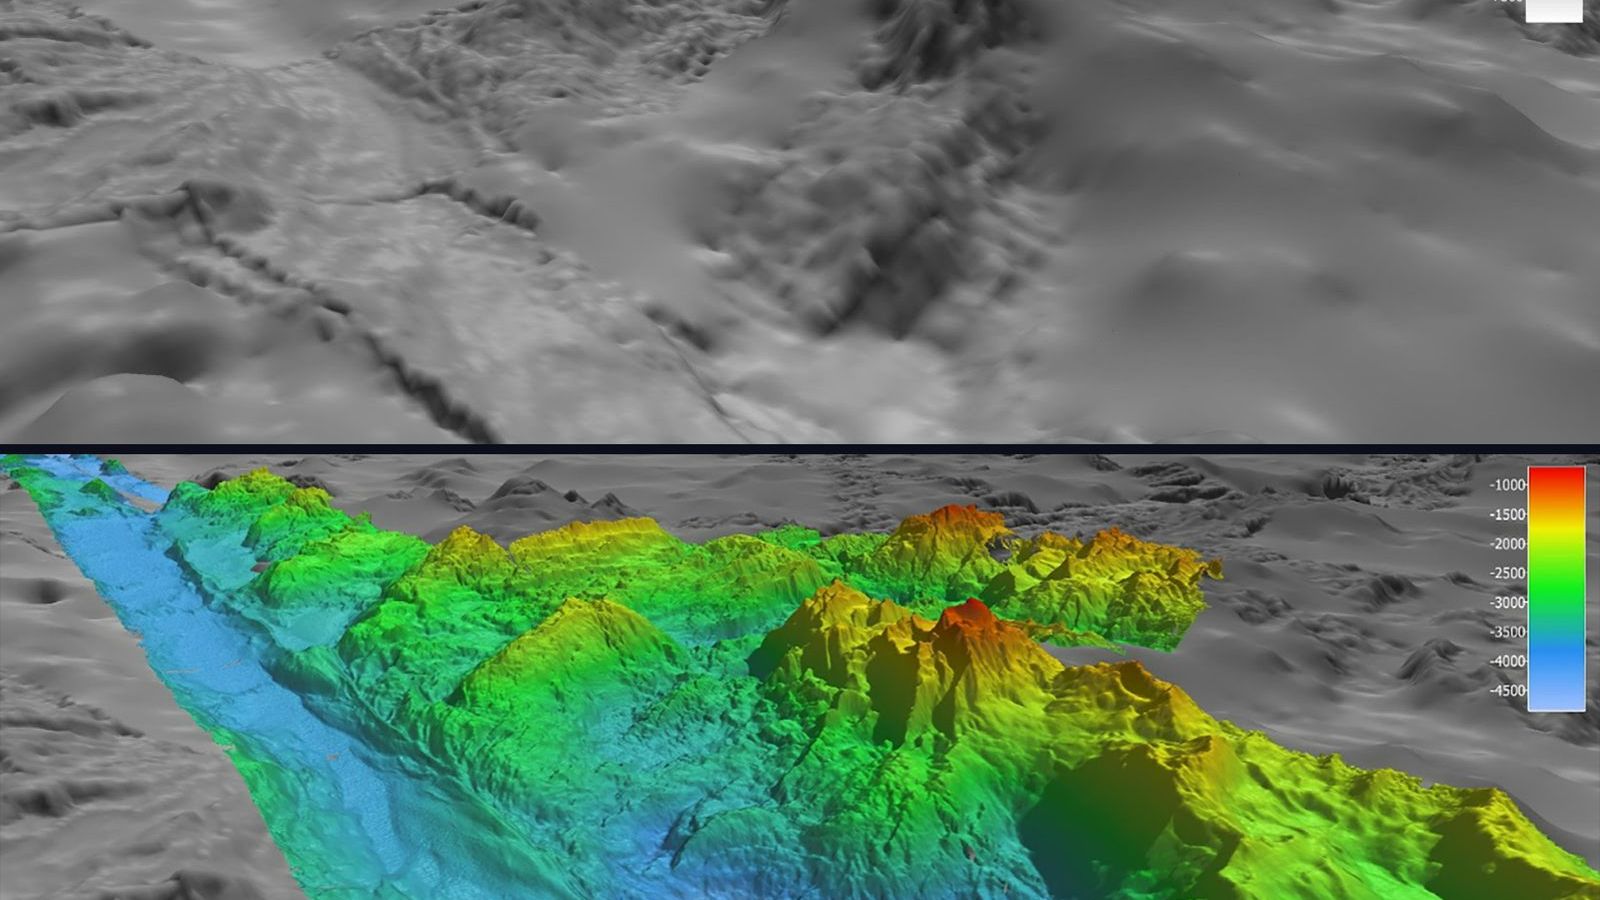
The sea is not flat. Leave out the waves and the tides and it still has hills and valleys, a metre or two high and hundreds of kilometres across, that stay in place for years. The middle of the North Atlantic between Bermuda and the Azores stands about a metre higher than the water off New York. A satellite with a radar can measure this to a few centimetres from orbit, and because the water on a rotating planet flows along the contours of these hills rather than down them, the height map is a current map. This is how the currents of the whole world ocean have been measured every ten days since 1992, without a single current meter.
The measurement
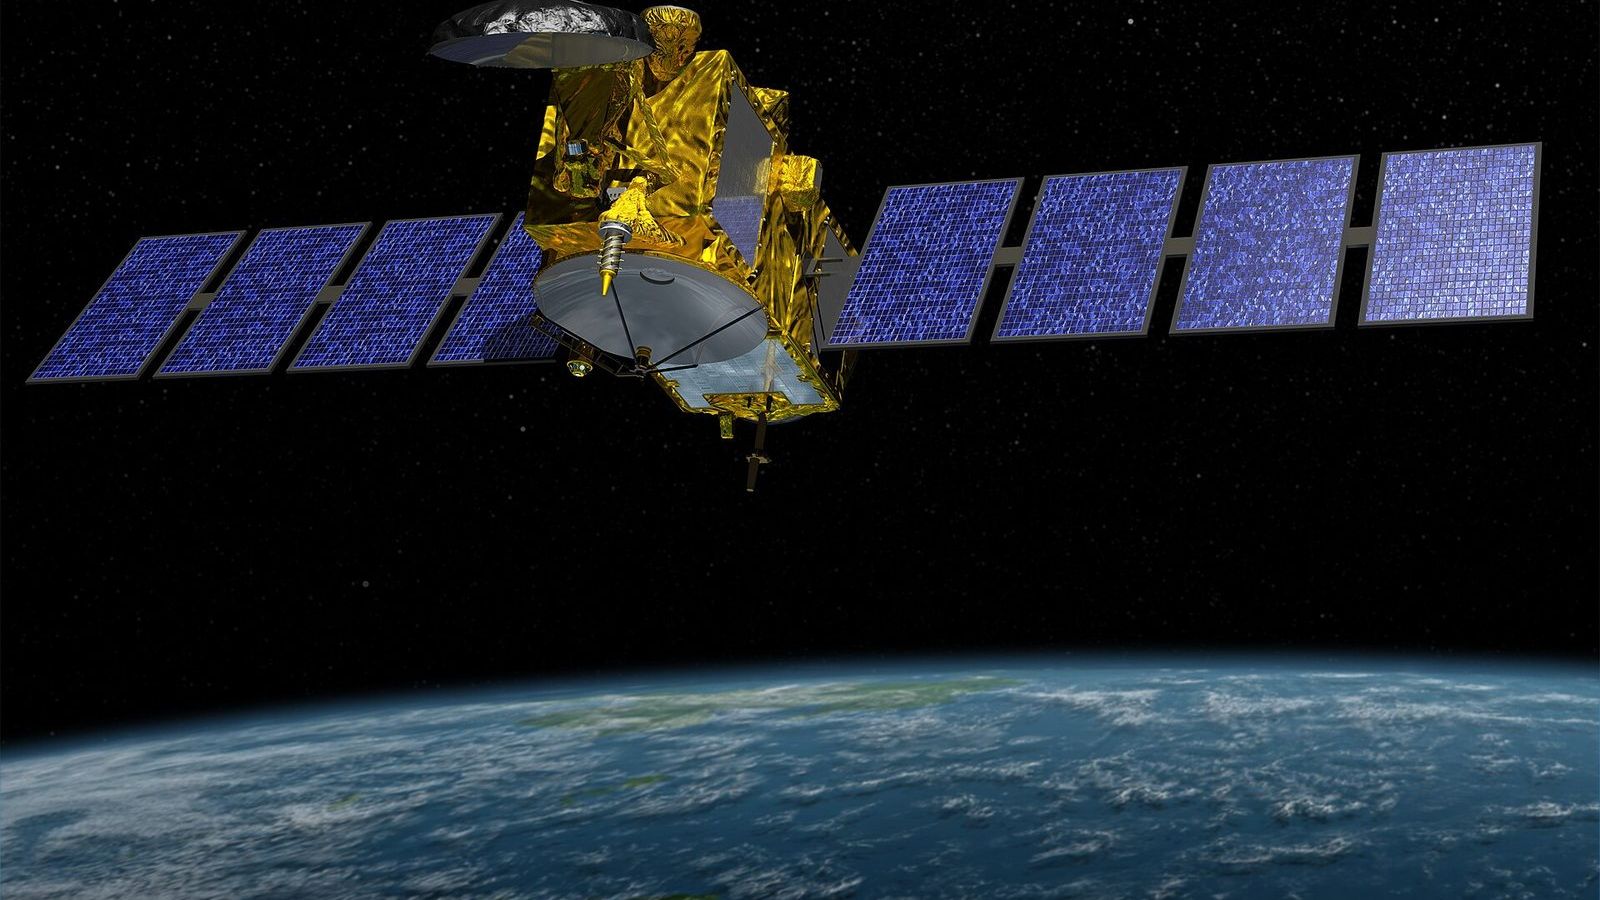
An altimeter satellite sends a radar pulse straight down and times the echo from the sea surface. At the speed of light a round trip from 1,336 km, the orbit of the Jason satellites and their successor Sentinel-6, takes about 9 milliseconds, and the timing is good enough to fix the distance to about 2 cm after corrections for the delay of the pulse in the atmosphere. The satellite's own position is tracked to a few centimetres by laser ranging and GPS. Subtract the one from the other and you have the height of the sea surface above the centre of the Earth, along a line under the satellite, every second, which is every 7 km along the track. The track repeats every ten days, so each point on the ocean is revisited three times a month.
TOPEX/Poseidon, launched by NASA and the French space agency in 1992, was the first altimeter good enough for this. Jason-1 followed in 2001, Jason-2 in 2008, Jason-3 in 2016, and Sentinel-6 Michael Freilich in 2020, each flying the same track so that the record is continuous. SWOT, launched in December 2022, measures a swath 120 km wide instead of a line and sees eddies ten times smaller than its predecessors.
Taking off the geoid
Most of the sea surface's shape has nothing to do with currents. The Earth's gravity is uneven, and a resting ocean would follow a surface of equal gravitational potential called the geoid, which bulges up to 100 m above or below a smooth ellipsoid over mountains and trenches. The part the oceanographer wants is the difference between the real sea surface and the geoid, called the dynamic topography, and it is a hundred times smaller than the geoid signal. For years the geoid was not known well enough, and altimetry could measure only changes in sea surface height from one pass to the next, which gives the eddies and the seasonal cycle but not the mean currents. The gravity satellites GRACE, launched in 2002, and GOCE, launched in 2009, measured the geoid to the centimetre, and since then the mean dynamic topography has been known too. The one-metre dome of the subtropical gyre is in that map.
From a slope to a speed
Why does a slope of the sea surface mean a current? Water on a slope feels a pressure force pushing it downhill. On a non-rotating planet it would flow downhill and the slope would flatten in a day. On the rotating Earth, a moving parcel of water is deflected by the Coriolis effect, to the right in the Northern Hemisphere, and for a large, slow, steady current the deflection balances the downhill push exactly. The water ends up flowing along the slope, not down it, with the high side on its right in the Northern Hemisphere. This is the geostrophic balance, and for a surface slope it reads
\[ v = \frac{g}{f}\,\frac{\partial \eta}{\partial x}, \]where \(\eta\) is the sea surface height, \(g\) is gravity, and \(f = 2\Omega\sin\varphi\) is the Coriolis parameter, about \(10^{-4}\) per second at mid-latitudes. The current \(v\) flows at right angles to the slope. Nothing about the water's temperature or salinity enters; the surface slope alone gives the surface current.
Put in the Gulf Stream. Across the stream off Cape Hatteras, at 38° N, the sea surface rises by about 1 m over 100 km, a slope of \(10^{-5}\). The Coriolis parameter there is \(2 \times 7.29 \times 10^{-5} \times \sin 38° = 9.0 \times 10^{-5}\) per second, so \(g/f\) is \(9.81 / (9.0 \times 10^{-5}) = 1.09 \times 10^{5}\) m/s. Multiply by the slope and the speed is 1.1 m/s, which is the right order; the core of the stream is narrower than 100 km and runs at about 2 m/s, and the altimeter, which smooths over 7 km samples, sees a little less. One metre of sea level, spread over a hundred kilometres, is a current you could not swim against.
What the maps show
The weekly maps of sea surface height, which the Copernicus Marine Service and NASA both publish, show the ocean as a field of bumps and hollows a few tens of centimetres high and 100 to 300 km across, drifting slowly west. These are the mesoscale eddies, the ocean's weather, and before altimetry nobody knew how many there were. A bump is a clockwise eddy in the Northern Hemisphere, by the rule above, and carries warm water in its core; a hollow turns anticlockwise and is cold. The Gulf Stream, the Kuroshio, and the Agulhas Current appear as sharp steps in the height field, and the rings they shed appear as bumps and hollows breaking away from the steps. The Agulhas rings, 200 km across and half a metre high, can be followed on the maps across the whole South Atlantic over two or three years.
The same measurement, averaged over the whole ocean, gives the rise of global mean sea level, about 3.3 mm per year since 1993 and faster in the last decade, which is the other reason the altimeters are kept flying.
Open NASA's State of the Ocean viewer, choose the sea surface height anomaly, and step through a month of maps east of Cape Hatteras. The meanders of the stream pinch off into rings in front of you, and with the formula above and a ruler you can estimate how fast the water in each ring is turning.
Unit 9 of the Ocean Masterclass derives the geostrophic balance from the equations of motion, works the Gulf Stream speed from the altimeter slope as its first example, and explains the thermal wind, the Rossby radius, and the eddies that the height maps reveal; Unit 5 introduces the gyre's dome and the Coriolis effect in words. The full list of units is in the curriculum.