 Image: Image courtesy of NOAA Ocean Exploration, Voyage to the Ridge 2022. (Public domain)
How much of the seafloor have we mapped?
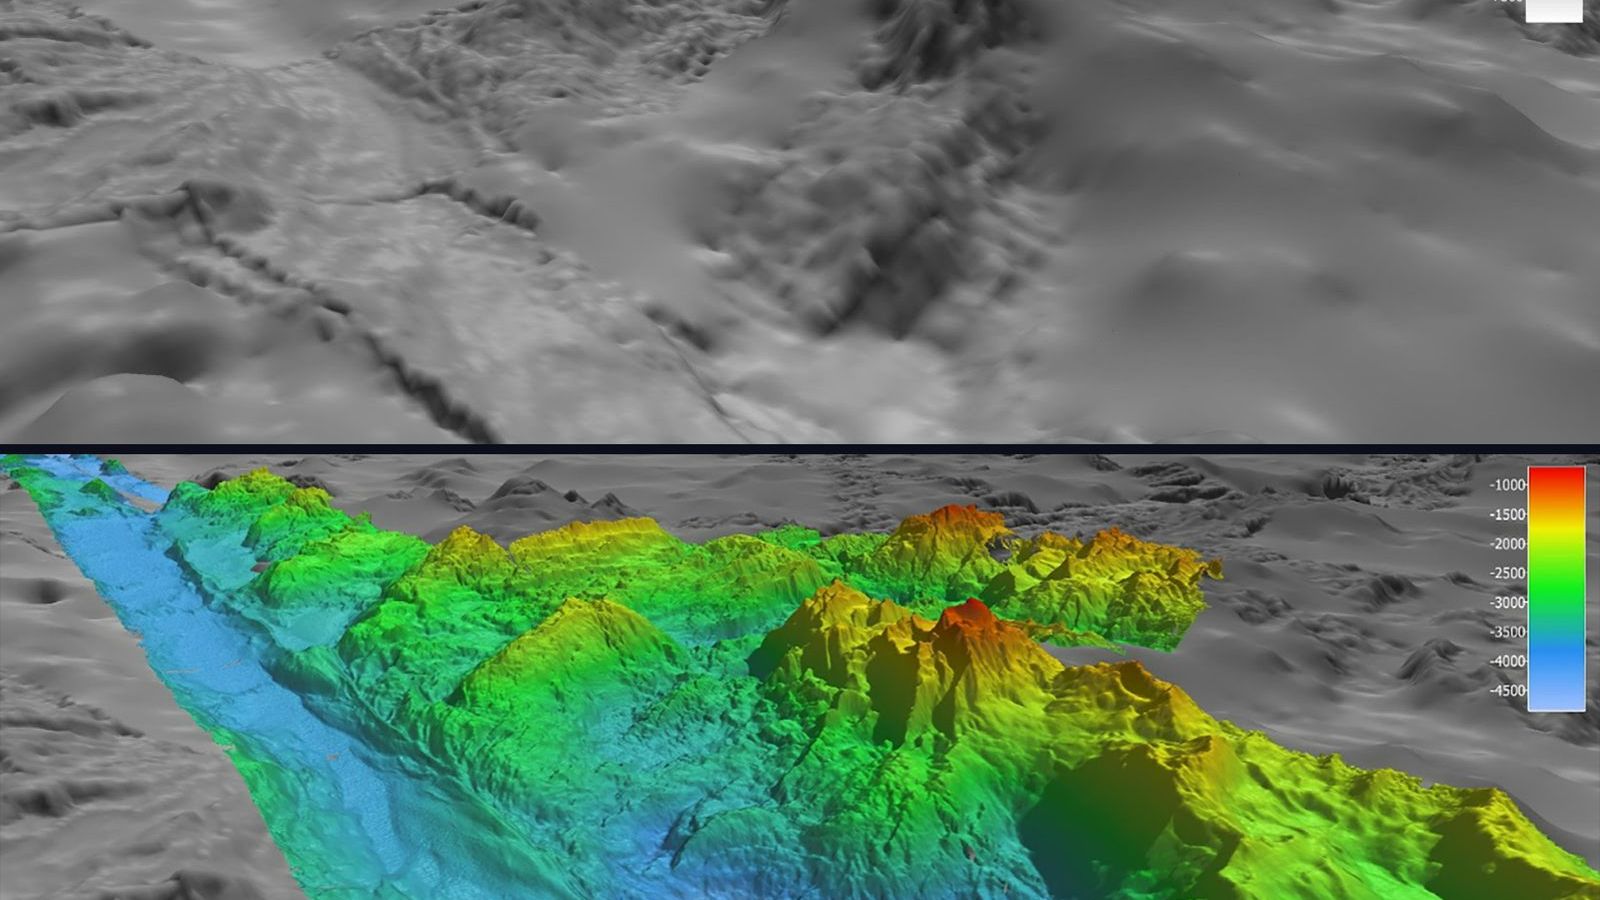
Every map of the ocean floor shows all of it, in blues and purples from the shelves to the trenches, and the picture is misleading in a way that matters. Only about a quarter of that floor has been measured. The rest is inferred from the shape of the sea surface, measured by satellite, at a resolution of several kilometres, and between the ship tracks there are mountains that nobody has seen. The Nippon Foundation-GEBCO Seabed 2030 project, which keeps the count, reported in June 2025 that 27.3 per cent of the seafloor had been mapped by direct measurement at a resolution adequate for its depth. When the project began in 2017 the figure was about 6 per cent.
How a ship measures the bottom
A multibeam echo sounder mounted in a ship's hull sends out a fan of sound pulses across the track and listens for the echoes from the bottom in several hundred directions at once. Sound travels in seawater at about 1,500 m/s, so an echo from 4,000 m returns after about 5.3 s, and the travel time in each direction gives the depth at a point across a swath beneath the ship. As the ship steams ahead, the swaths build a strip of measured seafloor. The width of the strip depends on the depth: in deep water the usable swath is about three to four times the depth, so a ship over the abyssal plain at 4,000 m maps a strip 12 to 16 km wide, with a depth point every 50 to 100 m. In 100 m of water the swath is a few hundred metres wide and the points are a few metres apart.
Why it takes so long
Take a ship mapping the abyssal plain at 4,000 m with a swath of 12 km, steaming at 10 knots, which is 18.5 km/h. In one hour it maps a strip 18.5 km long and 12 km wide, 222 km². In a day of continuous work, with no turns and no weather, that is about 5,300 km². The ocean's area is 361 million km², so one ship would need about 68,000 days, which is 186 years, to cover it once. Over the shelves, where the swath shrinks, the rate falls by a factor of ten or more. Estimates from the GEBCO community put the whole task at roughly 200 ship-years with the fleet and the methods available now, at a cost of a few billion dollars, which is a large sum and a smaller one than a single mission to Mars.
Most of the quarter that is mapped was not mapped on purpose. It is the record of research vessels crossing an ocean to reach a study site with their sounders switched on, of naval and commercial surveys for cables, pipelines, and shipping lanes, and of national programmes mapping their own continental shelves. Seabed 2030 gathers these records, which were scattered across hundreds of institutions and often never shared, into the grid that the General Bathymetric Chart of the Oceans publishes free every year.
What the satellites see
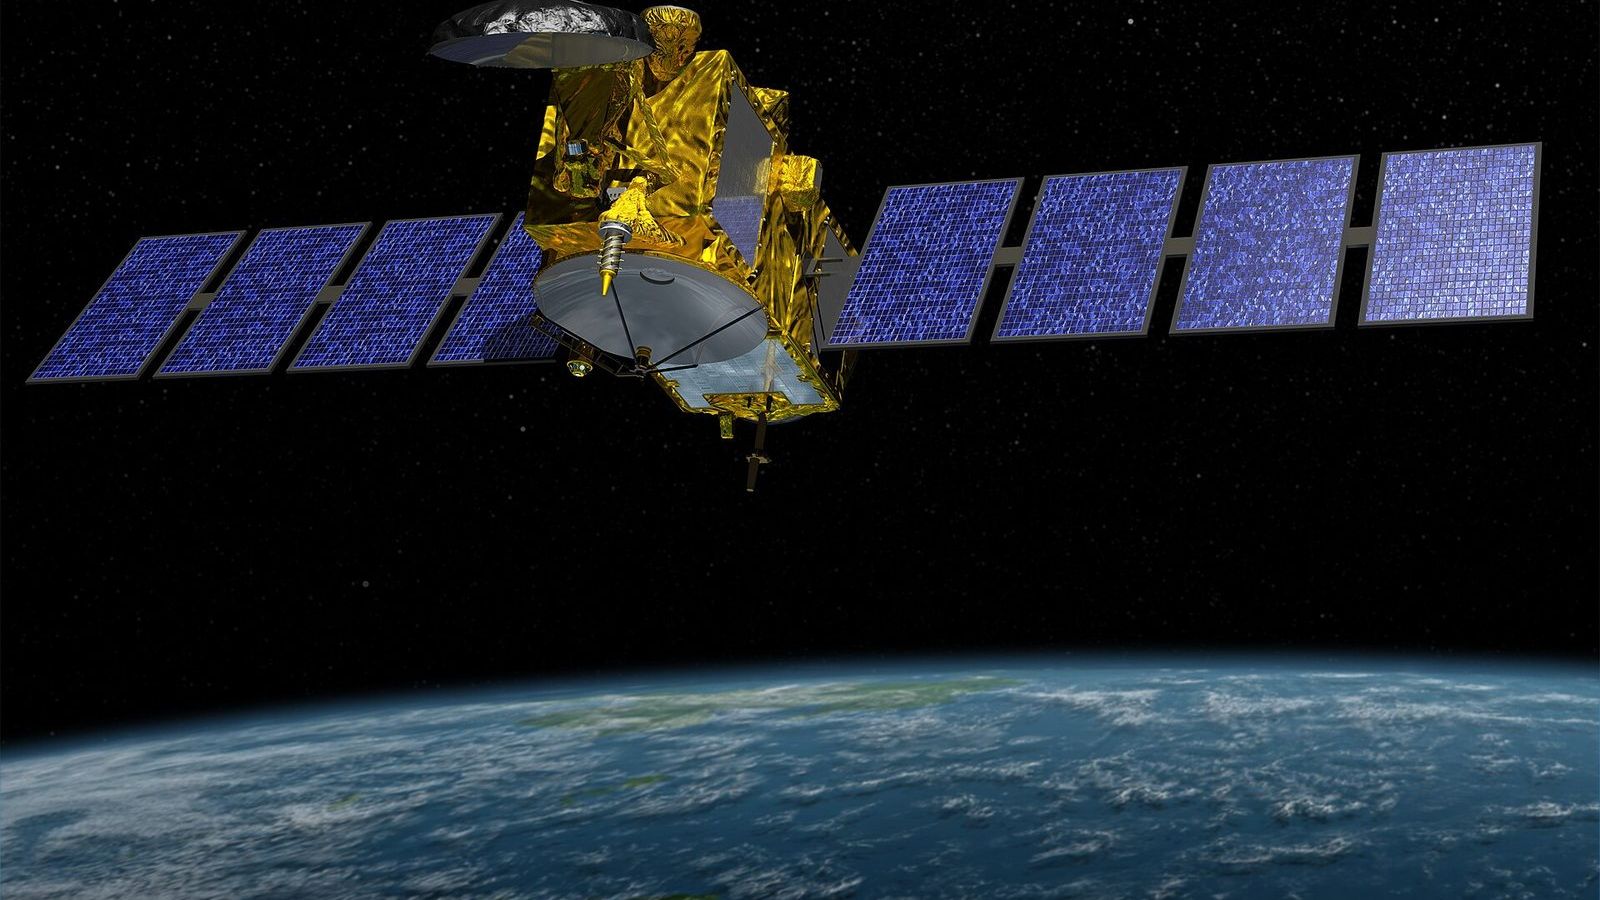
The purple map of the whole ocean comes from radar altimetry. A satellite measures its height above the sea surface to a few centimetres, and the surface is not flat: the extra gravitational pull of a seamount draws water towards it and raises the sea surface above it by a metre or so, while a trench lowers it. Walter Smith and David Sandwell showed in 1997 that this signal, combined with the sparse ship soundings, could be turned into a global map of the seafloor. The resolution is limited by the physics of gravity, which smooths out with distance from its source: features narrower than about 6 to 10 km do not show, and a seamount a kilometre high and a few kilometres across can be missing altogether. In 2023 a search of the improved gravity data found about 19,000 seamounts that no catalogue listed, bringing the total to more than 40,000, most of them never visited by a ship. Even with the newest altimeter, SWOT, launched in December 2022, which measures the surface in a swath rather than a line and is sharpening the gravity map to a few kilometres, the satellites cannot tell a smooth hill from a rough one, and it is the roughness, the cliffs and the ridges, that decides where the currents mix and where life gathers.
Why it matters
The depth of the ocean controls the speed of a tsunami and the path of a current, so the forecast of the one and the model of the other are only as good as the map. The breaking of internal waves over rough seafloor supplies much of the mixing that brings deep water back to the surface, and the models of the overturning circulation need the roughness to get the mixing right. Cables, pipelines, wind farms, and the search for the wreckage of flight MH370, which mapped 120,000 km² of the southern Indian Ocean in 2014 to 2017 and found the mountains that were not on the chart, all need the measured floor. And the depth of the deepest point, the Challenger Deep, was fixed at 10,935 m with an uncertainty of 6 m only in 2021, by combining the best multibeam data with pressure sensors lowered to the bottom; before that the published values spread over almost 100 m.
The comparison with Mars is made so often that it deserves to be made correctly. The whole surface of Mars has been mapped from orbit at a resolution of a few hundred metres, and parts of it at a few metres, because there is nothing in the way but thin air. The seafloor is better known than Mars in the quarter the ships have covered and far worse in the rest, because there are 4 km of water in the way, and water stops radar and light within a few hundred metres. Sound is the only thing that goes through it, and sound has to be sent from a ship.
You can see the difference yourself in the GMRT MapTool, which blends the ship surveys into the satellite map: pan across any ocean and the picture changes from crisp to blurred where the ship tracks end.
Unit 2 of the Ocean Masterclass covers the shape of the basins, the echo sounder and the multibeam swath, the ship-day calculation as a worked example, how the altimeter sees a seamount, and the Seabed 2030 project in a research spotlight. The full list of units is in the curriculum.