 Image: NASA/Michael Studinger (Public domain)
Why Arctic sea ice melts faster than Antarctic sea ice
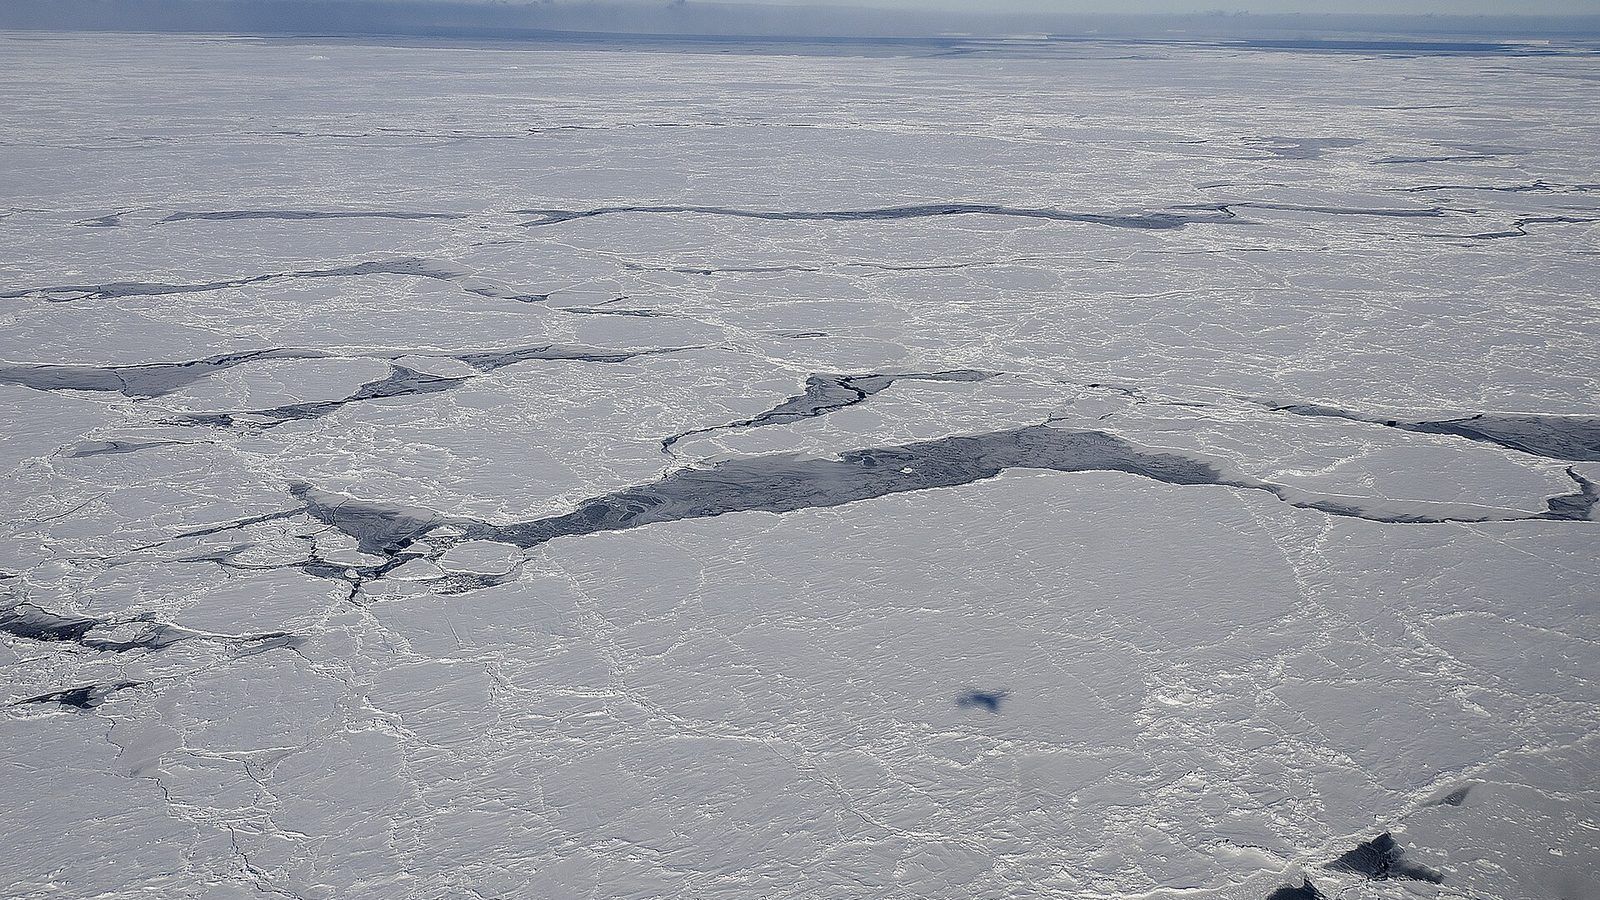
Two numbers set the scene. In September 1980 the Arctic Ocean was covered by about 7.5 million km² of sea ice at the end of the melt season; in September 2012 it was covered by 3.4 million km², the lowest in the satellite record, and recent Septembers have been between 4 and 5 million. Over the same period the sea ice around Antarctica showed no overall decline until 2016, grew slightly in some years, and then dropped to record lows in 2017, 2022, and 2023. Both poles are warming. Why does the ice respond so differently?
An ocean ringed by land and a continent ringed by ocean
The Arctic is a deep ocean basin almost enclosed by the land of Siberia, Alaska, Canada, and Greenland, with one wide opening to the Atlantic. Ice that forms there mostly stays there, drifting for years in the Beaufort Gyre or leaving slowly through Fram Strait east of Greenland. Because it stays, it thickens: ice that survives several summers grows to 3 or 4 m, and until the 1990s most of the Arctic pack was this multi-year ice. The ocean beneath is capped by a layer of cold, fresh water, fed by the great Siberian rivers, that floats on the warmer, saltier Atlantic water below and insulates the ice from it.
Antarctica is the opposite arrangement. The ice forms around a continent in a ring open to the whole Southern Ocean, and nothing holds it in. The winds and currents carry it north, away from the pole, into warmer water where it melts every spring. Almost all Antarctic sea ice is therefore first-year ice, about a metre thick, and the seasonal cycle is enormous: from about 3 million km² in February to about 18 million in September, so that the Antarctic grows and loses an area larger than Russia every year. There is no fresh lid; the water under the ice is close to the warm Circumpolar Deep Water, and much of the ice melts from below.
The feedback that favours the Arctic
Snow-covered ice reflects 80 to 90 per cent of the sunlight that falls on it; open water reflects about 6 per cent. When Arctic ice melts earlier in the summer, the dark water absorbs the sunlight the ice would have reflected, the water warms, and more ice melts from below, and the following autumn the thinner, younger ice that re-forms is easier to melt the next year. This is the ice-albedo feedback, and it is strongest where the ice retreats in high summer under a Sun that never sets, which is the Arctic in July. Consider one square kilometre of ice at an albedo of 0.6 that becomes water at an albedo of 0.06 under a summer sunshine of 200 W/m² on average. The extra energy absorbed is \((0.6 - 0.06) \times 200 = 108\) W/m², which over a square kilometre is 108 megawatts, enough to melt about 30 tonnes of ice a minute if it all went into melting. It does not all go into melting; much of it warms the water and the air, which is why the Arctic has warmed about three to four times faster than the global average, an effect called Arctic amplification.
The Antarctic ice is gone by the time the summer Sun is high, so there is less dark water exposed when it would matter most, and the Southern Ocean around it is being kept cool by the upwelling of deep water that last saw the surface centuries ago and has not yet felt the warming. For forty years that was enough to hold the Antarctic ice steady while the Arctic lost its own.
What the satellites measure
Sea ice has been mapped daily since late 1978 by passive microwave radiometers, which see the microwave glow of the surface through cloud and darkness and can tell ice from water. The standard measure is extent, the area of ocean with at least 15 per cent ice cover, and the National Snow and Ice Data Center publishes it every day. The Arctic September extent has fallen at about 12 to 13 per cent per decade relative to the 1981 to 2010 average, and the ice has thinned as well as shrunk: the multi-year ice that made up most of the pack in the 1980s is now a minority, and the mean thickness in late winter has fallen from over 3 m to under 2 m, measured first by submarines and now by the ICESat-2 and CryoSat-2 satellites. A loss of area and a loss of thickness together mean that the volume of Arctic ice in September is perhaps a quarter of what it was in 1980.
Take the two Septembers of the opening paragraph. From 7.5 million km² in 1980 to about 4.5 million as a typical recent value is a loss of 3 million km², which is 40 per cent in 45 years, or close to 9 per cent per decade of the starting value; measured against the 1981 to 2010 mean, as the data centre does, the trend is steeper, about 12 to 13 per cent per decade, because the baseline is lower than 1980.
What changed in the south
After the record high of 2014, Antarctic sea ice fell sharply in the spring of 2016 and has stayed low since, with a February 2023 minimum of 1.8 million km² and a September 2023 maximum of 17.0 million, about a million square kilometres below any previous winter. The cause is argued over. Warm water from the Southern Ocean's upper layers appears to have reached the surface and the underside of the ice, the winds shifted, and the ocean's capacity to keep the surface cool with old upwelled water may be reaching its limit. Whether this is the start of the decline the climate models always expected or a swing that will reverse is not yet settled, and honest scientists say so. What is settled is that the Antarctic's steadiness was never evidence against warming; it was evidence of a different ocean.
The record is free to explore. The Charctic graph plots every year since 1979 for either pole; add 1980, 2012, and the current year and the two stories are drawn for you.
Unit 12 of the Ocean Masterclass compares the two polar oceans, derives the Stefan law of ice growth, works the albedo example above, reads the trend from the NSIDC data, and goes on to the ice shelves and the sea-level contribution of the ice sheets. The full list of units is in the curriculum.