 Image: Stephane Lesbats (IFREMER, Pôle Images, Centre Bretagne - ZI de la Pointe du Diable - CS 10070 - 29280 Plouzané, France) (CC BY 4.0)
What 4,000 robots tell us about the warming ocean
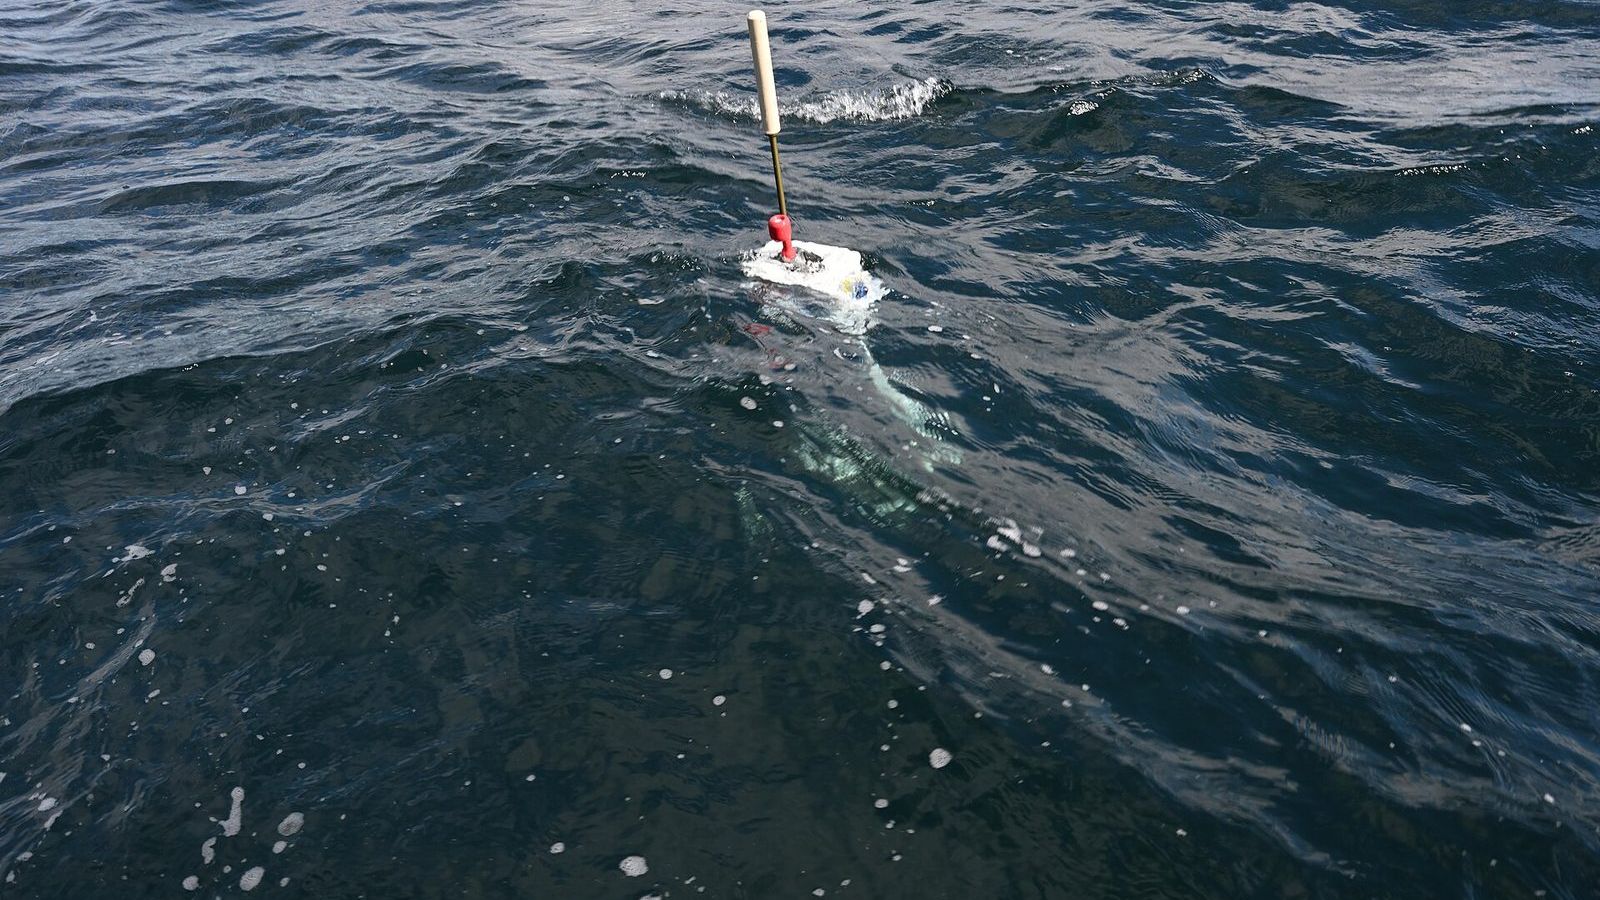
Somewhere in the ocean, about every four seconds, a yellow cylinder two metres long breaks the surface, points an antenna at the sky, and sends home a profile of the water it has just risen through. There are about 4,000 of these floats at any time, spread through every ocean except under the ice, and together they measure the temperature and salinity of the upper two kilometres of the sea about 140,000 times a year. The array is called Argo. It has been running since 2000, and it has changed how well the ocean is known more than any instrument since the echo sounder.
The ten-day cycle
An Argo float has no propeller. It moves up and down by pumping oil between an internal reservoir and an external bladder, which changes its volume and so its density. Pump the oil out and the float expands, becomes less dense than the water around it, and rises; pump it in and it sinks. A typical cycle goes like this. The float sinks to 1,000 m and drifts there for nine days, carried by whatever current flows at that depth. It then sinks to 2,000 m and rises to the surface over about six hours, measuring temperature, salinity, and pressure every couple of metres on the way. At the surface it fixes its position by satellite, transmits the profile, and sinks again. The whole cycle takes ten days, and a float lasts about 150 cycles, four to five years, before its battery runs out.
The depth is measured as pressure, in decibars, which is why the field quotes profiles in dbar; one decibar corresponds to almost exactly one metre. Salinity is measured as electrical conductivity and converted. The floats are built by a handful of laboratories and companies, and the data are checked and released within a day, free, through two data centres. Nobody owns them, and anyone can download every profile ever taken from the Argo programme's site.
Why 4,000 is the right number
The original design, agreed in 1998, called for one float in every 3° by 3° box of ocean, about 3,000 floats, enough to resolve the large patterns of the ocean month by month. The 3,000th float was deployed in November 2007. Since then the array has grown to about 4,000, and two extensions are under way: Deep Argo floats that profile to 4,000 or 6,000 m, and biogeochemical floats that also measure oxygen, nitrate, pH, and chlorophyll. Dean Roemmich of the Scripps Institution of Oceanography, one of the array's designers, set out the plan for the next decade in a paper in 2019 that the first unit of this masterclass presents.
Before Argo, the deep ocean was measured from research ships, which are expensive, slow, and seasonal. The Southern Ocean in winter had almost no measurements at all; floats do not mind the weather. The number of temperature profiles below 1,000 m taken each year rose by a factor of about twenty when the array filled.
What the profiles add up to
The reason climate scientists care about the array is heat. When greenhouse gases trap more of the Sun's energy than the planet radiates back to space, the surplus has to go somewhere, and the ocean, with its enormous heat capacity, takes most of it. The Intergovernmental Panel on Climate Change puts the ocean's share of the excess heat accumulated since 1971 at about 91 per cent, with the melting of ice, the warming of the land, and the warming of the atmosphere sharing the rest. To know how fast the planet is warming, you have to measure the ocean, and the ocean is measured by the floats.
The quantity is called the ocean heat content. It is the sum, over every cubic metre of water, of the density times the heat capacity times the temperature change: in words, how many joules the ocean has gained. The numbers are large enough to need a prefix most people have not met. One zettajoule, 1 ZJ, is \(10^{21}\) joules, roughly ten years of the world's electricity production. The upper 2,000 m of the ocean gained about 10 ZJ per year averaged over the 2010s, and the yearly records published by Lijing Cheng of the Chinese Academy of Sciences and his colleagues have reported a new high almost every year since, with 2024 the warmest year in the record so far.
To see what 10 ZJ per year does to the water, spread it through the top 2,000 m. The ocean's area is 361 million km², so that layer holds about \(7.2 \times 10^{17}\) m³ of water, or \(7.4 \times 10^{20}\) kg at a density of 1,025 kg/m³. With a heat capacity of about 4,000 J per kilogram per degree, warming it by one degree takes \(3 \times 10^{24}\) J, which is 3,000 ZJ. Ten zettajoules a year is therefore a warming of about 0.003 °C per year averaged over the layer, or 0.03 °C per decade. The number is small because the layer is so thick; near the surface the warming is ten times faster. The same calculation is why the ocean's warming is measured in joules rather than degrees: a few hundredths of a degree is hard to picture, and a few hundred zettajoules is not, once you know what one is.
What else the floats have found
The salinity profiles have shown that the salty parts of the ocean, the subtropical surface waters, are getting saltier, and the fresh parts, near the poles and the equator, fresher, which is the fingerprint of more evaporation and more rain, a stronger water cycle on a warmer planet. The temperature profiles have shown that most of the recent warming is in the Southern Hemisphere oceans, and that the Southern Ocean takes up a share of heat out of proportion to its area. Floats trapped under Antarctic sea ice in winter, which store their profiles and transmit when they surface in spring, have given the first measurements of the water under the ice through a whole season. And the floats have confirmed, by comparison with satellite measurements, that about a third of the rise in global sea level since 1993 is thermal expansion: warmer water takes more room.
You can watch the array work. The Euro-Argo fleet monitoring page shows every active float on a map with its last profile. Pick one near your coast and look at the thermocline.
Unit 1 of the Ocean Masterclass explains how a float fixes its position and depth and how to read the profile it sends, and Unit 4 works through the heat budget of the sea surface and the ocean heat content record. The full list of units is in the curriculum.