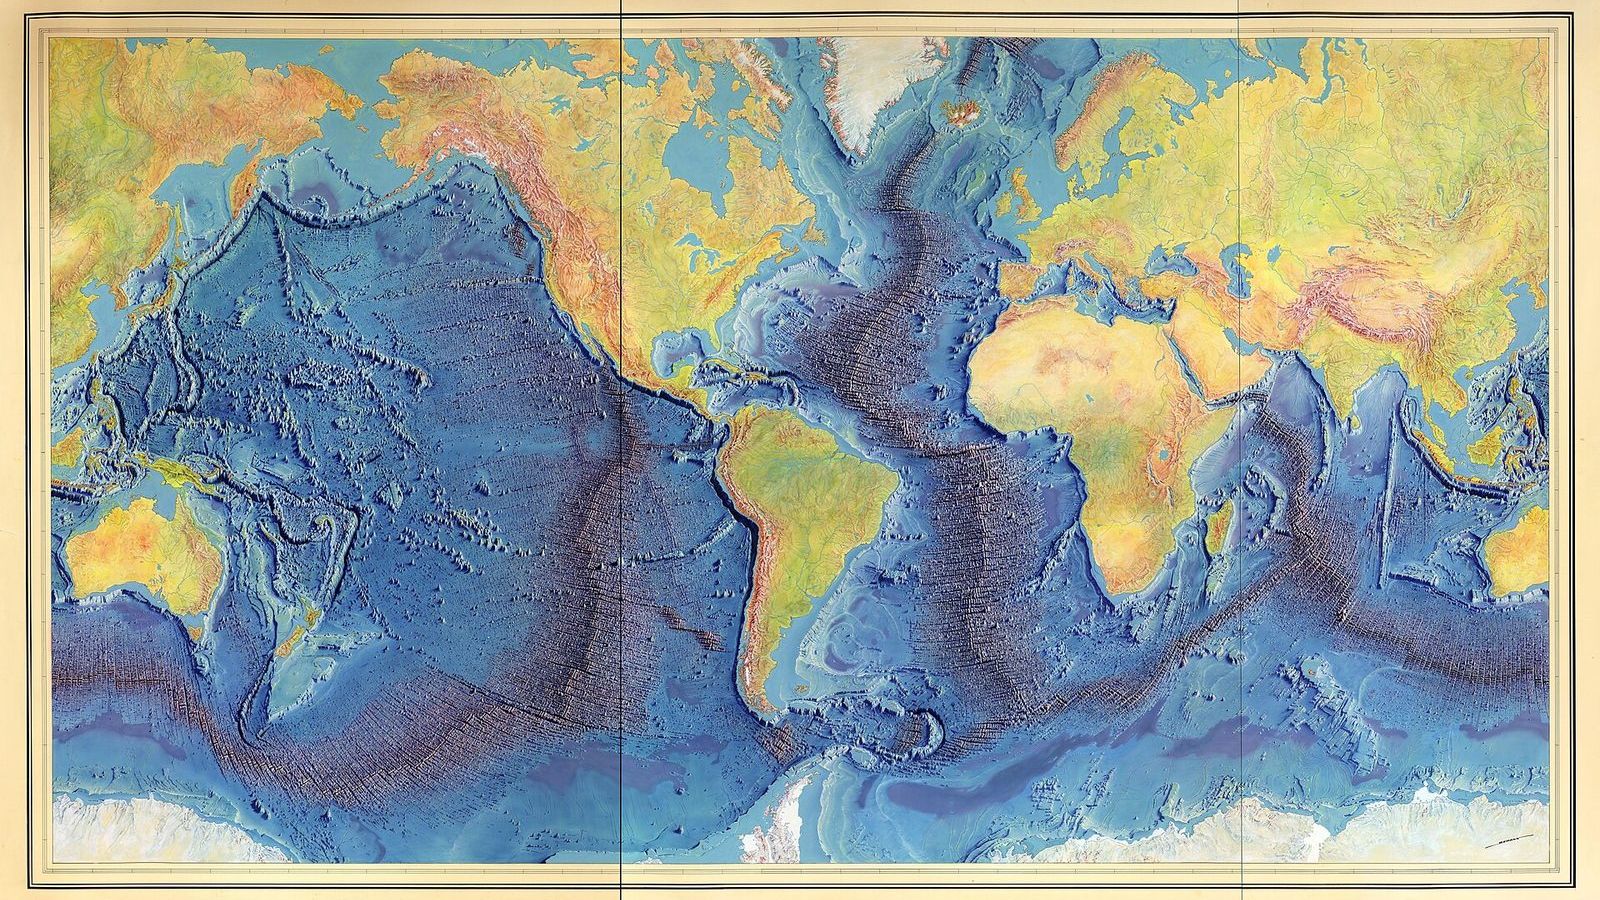
 Image: Berann, Heinrich C., Heezen, Bruce C., Tharp, Marie. (CC0)
How Marie Tharp found the rift in the Mid-Atlantic Ridge
In 1952 Marie Tharp sat at a drafting table at the Lamont Geological Observatory north of New York with six long strips of paper. Each strip was an echo-sounding profile of the Atlantic, the depth of the seafloor recorded minute by minute as a research ship crossed from the United States to Africa. Tharp's job was to turn the strips into cross-sections of the ocean floor. When she had plotted all six, at the same scale, one above the other, she saw something in every one of them: at the crest of the Mid-Atlantic Ridge, where the floor should have been highest, there was a notch. A valley ran down the middle of the mountain range, 1 to 2 km deep and 20 to 50 km wide, and it was in the same place on all six crossings.
A mountain range with a crack along it
That the Atlantic had a ridge down its middle had been known since the 1870s, when the sounding lines of HMS Challenger found shallower water in mid-ocean. The German Meteor expedition of 1925 to 1927 had crossed the South Atlantic fourteen times with an early echo sounder and shown that the ridge was continuous and rough. What nobody had seen was its shape in detail, because a profile every few hundred kilometres is not enough to see a valley unless you know to look for one. Tharp looked, and she knew what the shape meant. A central valley is what a mountain range looks like when it is being pulled apart. The East African Rift has one. If the Mid-Atlantic Ridge had one, the Atlantic floor was being stretched, and the continents on either side were moving away from each other.
Continental drift was, in the United States of 1952, close to a forbidden idea. Alfred Wegener had proposed it in 1912 and had been dismissed, mostly because nobody could say what force moved a continent through the solid rock of the ocean floor. Bruce Heezen, the geologist Tharp worked for, told her the valley was "girl talk" and asked her to redo the plots. She did, and the valley was still there.
The earthquakes that settled it
The argument ended because of a different project in the same room. Heezen had taken on a contract from Bell Laboratories, which wanted to know where transatlantic telephone cables were most likely to break, and he had an assistant, Howard Foster, plot the epicentres of every earthquake recorded in the Atlantic. The two maps were drawn at the same scale. When Foster's earthquake map was laid over Tharp's profiles, the earthquakes fell in a narrow band exactly along the valley. Earthquakes happen where rock breaks, and rock breaks where it is pulled apart. The valley was active.
Heezen came round, and from then on the two worked together. In 1956 he announced the rift valley at a meeting of the American Geophysical Union, and in 1957, when the Princeton geologist Harry Hess heard it, he said it had shaken the foundations of geology. Tharp and Heezen then showed that the earthquake band, and so the rift, could be followed out of the Atlantic, around Africa, through the Indian Ocean, and across the Pacific, a crack about 65,000 km long. It is the longest mountain range on Earth, and almost all of it is under water.
Drawing a floor nobody could see
Tharp's second contribution was the maps themselves. The United States Navy classified detailed bathymetric contours during the Cold War, so a conventional contour map of the Atlantic could not be published. Tharp and Heezen chose instead to draw a physiographic diagram, an oblique view of the floor as it would look if the water were removed, with the ridge, the abyssal plains, the seamounts, and the continental slopes drawn as terrain. It required judgement, because the ship tracks covered a small fraction of the floor and everything between them had to be sketched from what the geology implied. The first, of the North Atlantic, appeared in 1959 in a publication of the Geological Society of America. The South Atlantic followed in 1961 and the Indian Ocean in 1964.
In 1977 the painter Heinrich Berann, who had made panoramic maps of the Alps for the National Geographic Society, turned their work into the World Ocean Floor panorama, the picture of a blue planet with its ridges and trenches that most people now carry in their heads. Berann painted it; Tharp and Heezen supplied every line of the relief. Heezen died that year, at 53, aboard a submarine on a survey of the Reykjanes Ridge. Tharp lived until 2006.
Reading one of her profiles yourself
The profiles Tharp plotted were made by timing the echo of a sound pulse from the ship to the floor and back. Sound travels in seawater at about 1,500 m/s, so a depth \(H\) returns an echo after a time \(t = 2H/c\). A typical mid-Atlantic crossing of the 1950s shows an echo time of about 6.7 s over the abyssal plain, which is a depth of \(1{,}500 \times 6.7 / 2 = 5{,}000\) m, falling to about 3.3 s, or 2,500 m, over the ridge crest, and then rising again by a second or more in the middle. That extra second is the rift valley, 750 m of depth in a few kilometres of track.
With a free tool you can repeat the exercise. The GMRT MapTool of the Lamont-Doherty Earth Observatory, the institution Tharp worked for, lets you draw a profile across the Mid-Atlantic Ridge anywhere you like and read the depth along it. Draw one at 30° N and the notch is there, exactly where she saw it.
Why it mattered
The rift valley was the first piece of a chain of evidence. Hess proposed in 1960 that new seafloor is made at the ridge and carried away on both sides, and in 1963 Fred Vine and Drummond Matthews showed that the magnetic stripes measured on either side of a ridge are the record of that spreading, mirrored about the axis. Within a decade plate tectonics was the accepted framework of geology. Tharp received little recognition at the time; she was not an author on the 1956 announcement and was for years listed as Heezen's assistant. The Library of Congress named her one of the four greatest cartographers of the twentieth century in 1997, and the Lamont-Doherty Earth Observatory now awards a fellowship in her name.
Unit 2 of the Ocean Masterclass covers the shape of the ocean basins, the plate tectonics that explain them, the magnetic stripes, and how the seafloor is mapped today, with Tharp's profiles as an excursion. The full list of units is in the curriculum.